Figure 7.

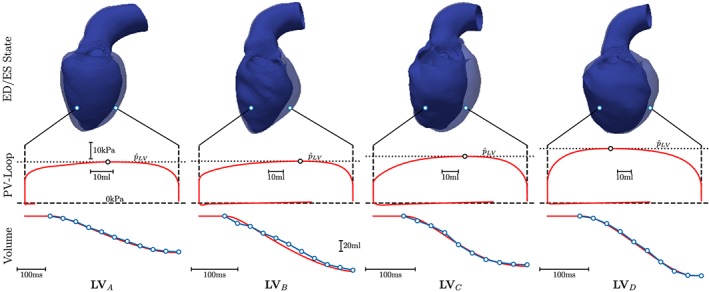
Fitting of EM LV models (red traces) using Cine‐MRI‐based volume data (blue traces) and estimated LV peak pressures, , as input. Top panels show LV anatomy in end‐diastolic (transparent blue) and end‐systolic (solid blue) configuration

Fitting of EM LV models (red traces) using Cine‐MRI‐based volume data (blue traces) and estimated LV peak pressures, , as input. Top panels show LV anatomy in end‐diastolic (transparent blue) and end‐systolic (solid blue) configuration