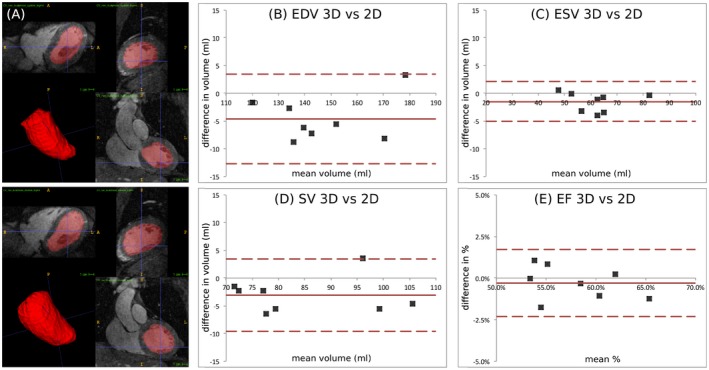
Figure 6.

(A) Semi‐automatic segmentation for a representative subject, showing 3 orthogonal planes for systole and diastole and corresponding rendering of the left ventricular cavity. Bland‐Altman plots of (B) end diastolic volume (EDV), (C) end systolic volume (ESV), (D) stroke volume, (SV) and (E) ejection fraction (EF) comparing dual‐phase 3D CMRA images and conventional multi‐slice 2D CINE acquisition. Middle red line: mean difference; upper and lower dashed red lines: 95% limits of agreement
