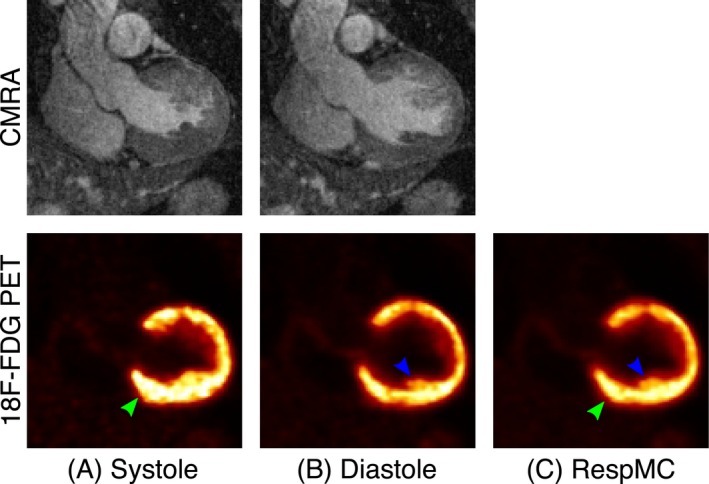
Figure 7.

Coronal views from CAD patient 3 data set showing respiratory motion‐corrected (A) systolic and (B) diastolic CMRA and 18F‐FDG PET images alongside the (C) respiratory motion‐corrected (RespMC) PET image. RespMC aggregates data acquired at different cardiac phases, resulting in cardiac‐induced blurring of small structures (blue arrow) and apparent thickening of the myocardium (green arrow)
