Figure 1.

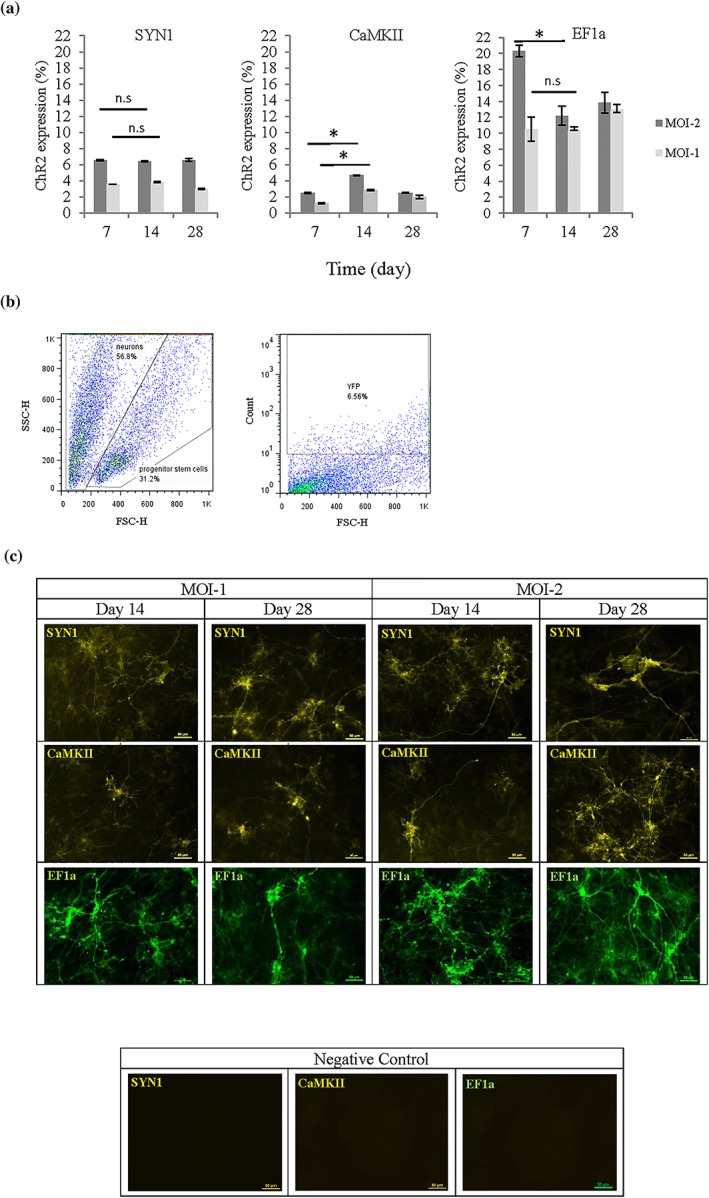
Expression of fluorescent tagged ChR2 in 2D neural cultures of transduced Axol cells under different promoters: channelrhodopsin‐2‐enhanced yellow fluorescent protein‐synapsin‐1 (SYN1), ChR2‐eYFP‐calciumcalmodulin kinase II (CaMKII), and ChR2‐GFP‐elongation factor‐1 alpha (EF1a). (a) Transduction efficiency was assessed using flow cytometry and the graphs show positive ChR2 expression quantified for each time point. Expression of the universal promoter, EF1a was used as a positive control. Axol cells were transduced using different conditions, and with one or two multiplicities of infection (MOI‐1 and MOI‐2). Significance was assessed using ANOVA; * = p < 0.05; Error bars denote standard deviation (±SD), n = 3. (b) An example showing how gating was used to quantify flow cytometry results for eYFP‐ChR2 expression under the SYN1 promoter. Nontransduced cells were used in setting the gating region, and ChR2‐eYFP positive neurons were quantitated. (c) Fluorescent imaging reveals that ChR2 was distributed evenly. Cells were imaged using a fluorescence microscope (Nikon Eclipse Ti‐E, Japan). Negative controls: images of non‐transduced cells taken using identical setting, indicate that positive signal does not arise from non‐specific fluorescence. Scale bar: 50 μm [Colour figure can be viewed at wileyonlinelibrary.com]
