Figure 6.

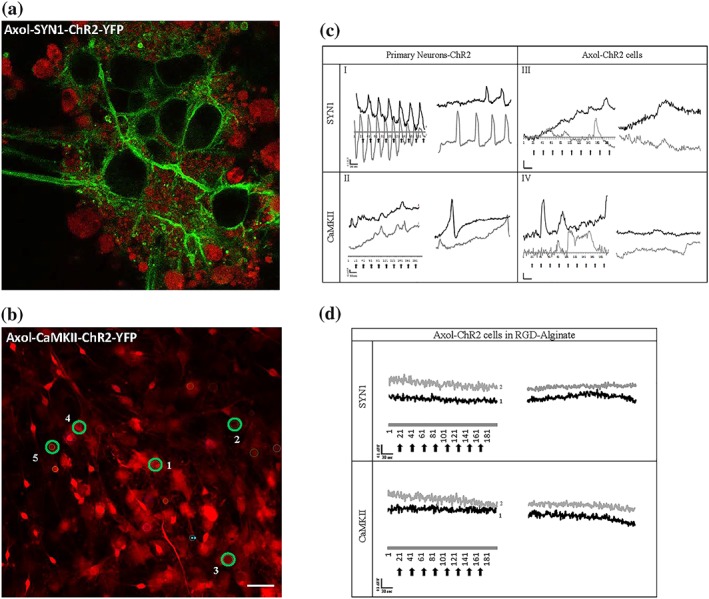
Response of Axol cells expressing ChR2‐eYFP driven by both SYN1 and CaMKII promoters to light stimulation. (a) High magnification image of Axol cells transduced to express ChR2‐eYFP localised in the membrane (green) and loaded with CAL‐590 calcium indicator (red). Samples were imaged using confocal microscopy at an excitation wavelength of 540/565 nm (Zeiss‐LSM 710). Magnification: 40x. (b) Lower magnification image showing CAL‐590 calcium dye stained Axol cells cultured in 2D, with five regions of interest (ROI) marked (green circles). Scale bar: 50 μm. (c) Calcium flux traces of primary neurons and Axol cells, and (d) calcium flux traces of Axol cells in RGD‐alginate expressing ChR2‐eYFP loaded with CAL‐590 (calcium dye showing traces from two regions of interest for (c) and (d), black line: ROI‐1 and grey line: ROI‐2. The cells were optically stimulated with a laser at 488 nm every 30 sec (200 frames), and the fluorescence intensity was normalised to the level of baseline fluorescence measured before the onset of the calcium signal (∆F/F). Scale = 0.1 ΔF/F (y‐axis); 30 sec (x‐axis); black arrows: light stimulation; scale bar: 50 μm [Colour figure can be viewed at wileyonlinelibrary.com]
