
Figure 2.
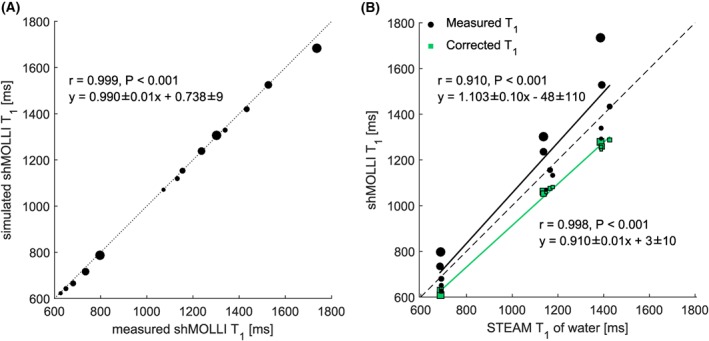
A, “Forward” shMOLLI simulation of the phantoms shows excellent agreement with measured shMOLLI T 1 values. B, Correlation between shMOLLI T 1 and spectroscopy‐based T 1 increases after removing the effects of fat. It is expected to obtain shMOLLI T 1 values lower than those obtained from spectroscopy after the determination of water shMOLLI T 1 values.32 Points on both graphs are size‐coded as a function of phantom PDFF