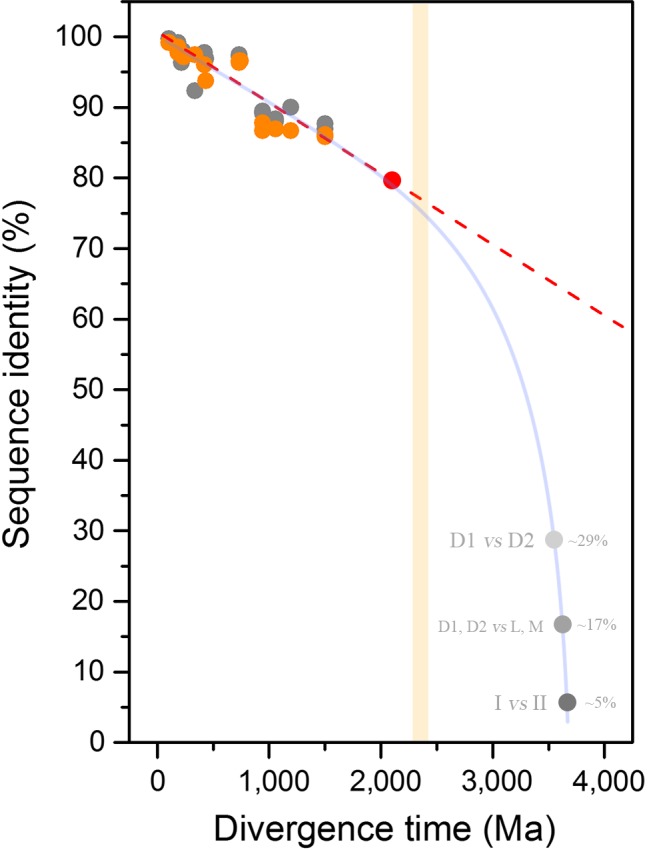
Figure 2.

Decrease of sequence identity of D1 and D2 proteins as a function of divergence time. D1 subunits are shown in gray and D2 in orange. The divergence time between pairs of species is plotted against the level of sequence identity as tabulated in Supplementary Table S1. The red circle, placed at 79.2%, corresponds to the average sequence identity of the three distinct Group 4 D1 sequences of Gloeobacter violaceous in comparison with that of Cyanidioschyzon merolae. The light orange bar marks the GOE. The dashed line is fitted from a linear function and shows that over a period of at least 2.0 Ga, no dramatic changes in the rates of evolution of D1 and D2 are observed. The red dashed lines show an extrapolation of current rates of evolution throughout Earth's history. This line highlights that the rate is too slow for the divergence of D1 and D2 to have started right before the GOE. The gray dots around 3.5–3.8 Ga mark a speculative timing for the earliest events in the history of photosynthesis: the divergence of D1 and D2 (~29% sequence identity), the divergence of anoxygenic (L/M) and oxygenic (D1/D2) reaction center proteins (~17%), and the divergence of Type I and Type II reaction center proteins (≤10%). The curved blue line highlights that any scenario for the diversification of reaction centers after the origin of life requires faster rates of evolution at the earliest stages in the evolution of photosynthesis [Colour figure can be viewed at wileyonlinelibrary.com]
