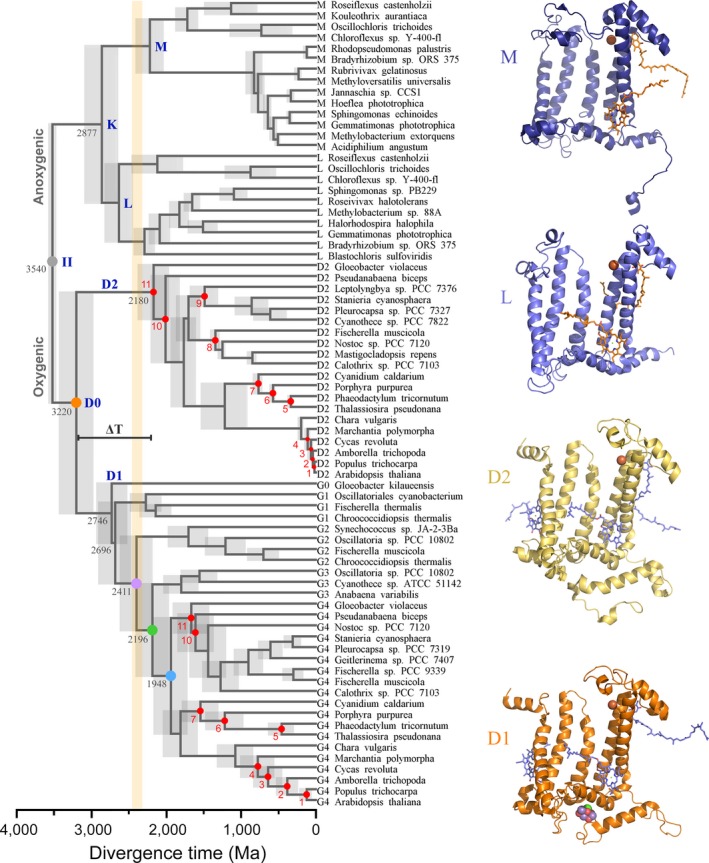
Figure 3.

Relaxed molecular clock of Type II reaction center proteins. A log‐normal autocorrelated relaxed clock is shown implementing a CAT + GTR + Γ model with flexible boundaries on the calibration points. Red dots are calibration points as described in Materials and Methods. The gray dot denoted II represents the ancestral Type II reaction center protein, as schematized in Figure 1. The orange dot (D0) marks the initial divergence of D1 and D2. The violet dot marks the divergence point between G2 atypical D1 sequences and standard D1. The green dot marks the divergence point between the microaerobic D1 forms (G3) and the dominant form of D1 (G4). This point represents the last common ancestral protein to all standard D1 forms predating crown group Cyanobacteria. The blue dot represents the origin of the dominant form of D1 inherited by all extant Cyanobacteria and photosynthetic eukaryotes. The gray bars represent the standard error of the estimated divergence times at the nodes. The orange bar shows the GOE [Colour figure can be viewed at wileyonlinelibrary.com]
