Figure 5.

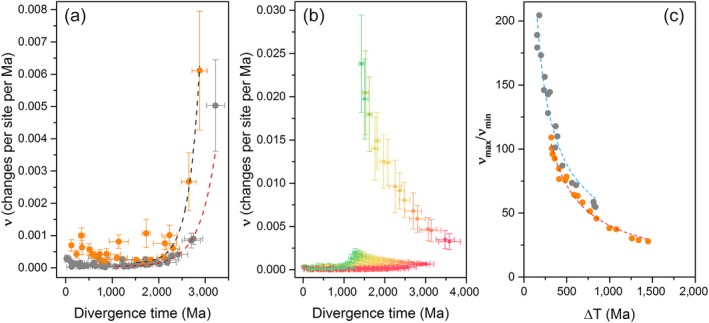
Rates of evolution as a function of time. (a) Change in the rate of evolution of oxygenic (gray) and anoxygenic (orange) Type II reaction center proteins. The rates correspond to the tree in Figure 3, assuming an origin of photosynthesis at about 3.5 Ga. The dashed lines represent a fit of a single‐component exponential decay and the rates are given as amino acid substitutions per site per million years. (b) Changes in the rate of evolution constraining the root to younger and younger ages. The red curve farthest to the right was calculated using a root prior of 4.2 ± 0.05 Ga, while the green curve farthest to the left was calculated using a root prior of 0.8 ± 0.05 Ga. Younger divergence times imply initial faster rates of evolution. (c) Change in the rate of evolution as a function of ΔT, the dashed lines represent a fit to a power law function. The curve in orange was calculated using ΔT values subtracting the mean average of the divergence times of D0 and the ancestral standard D1. The curve in gray was calculated using ΔT values subtracting the minimum age of D0 and the maximum age for ancestral standard D1 [Colour figure can be viewed at wileyonlinelibrary.com]
