
Figure 2.
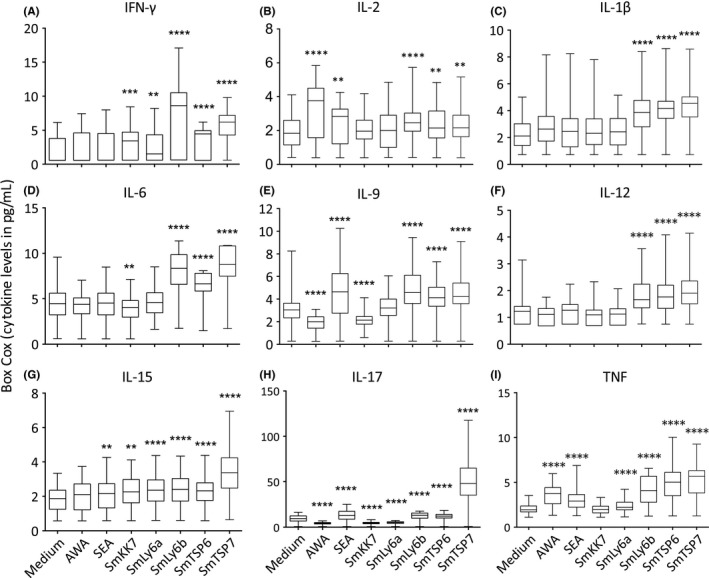
Box‐Cox transformed Th1 (A, B) and pro‐inflammatory (C‐I) cytokine levels in response to stimulation of PBMCs from Schistosoma mansoni‐infected participants (n = 54) before PZQ treatment with AWA, SEA and schistosomula antigens compared with medium. Box and whisker plots show median, interquartile range, maximum and minimum of cytokine levels. A paired Student's t test was used to test differences between medium and antigens. *P < 0.05, **P < 0.007, ***P < 0.001, ****P < 0001