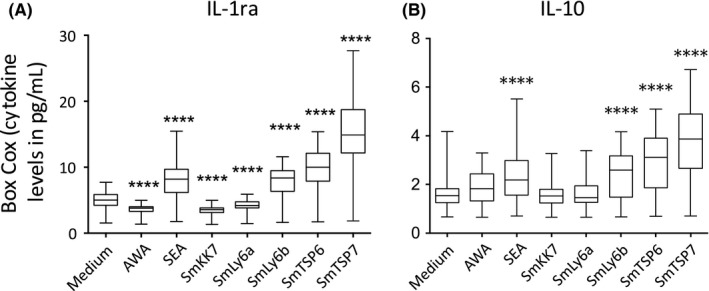
Figure 3.

Box‐Cox transformed regulatory cytokine levels in response to stimulation of PBMCs from Schistosoma mansoni‐infected participants (n = 54) before PZQ treatment with AWA, SEA and schistosomula antigens compared with medium (A) IL‐1ra and (B) IL‐10. Box and whisker plots show median, interquartile range, maximum and minimum of cytokine levels. A paired Student's t test was used to test differences between medium and antigens. *P < 0.05, **P < 0.007, ***P < 0.001, ****P < 0.0001
