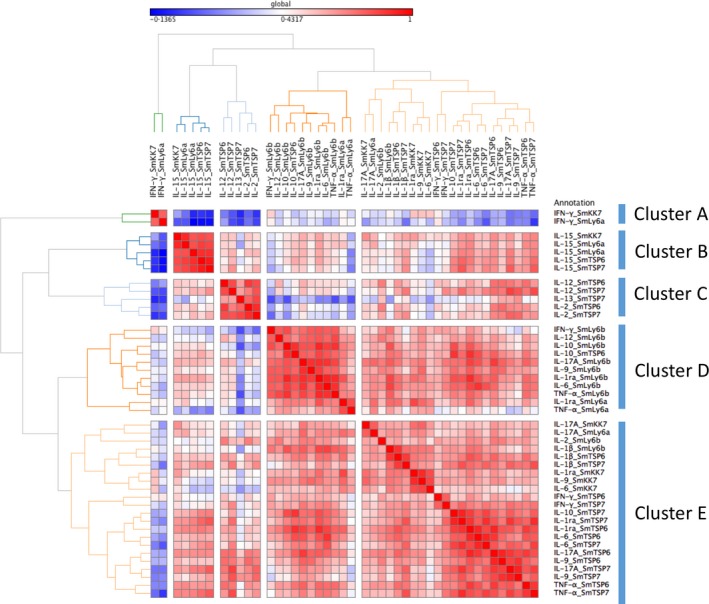
Figure 4.

Unsupervised hierarchical clustering of cytokine responses from PBMCs of Schistosoma mansoni‐infected participants (n = 54) before PZQ treatment stimulated with S. mansoni schistosomula antigens. Red and blue colours indicate strong positive and negative correlations respectively
