Figure 5.

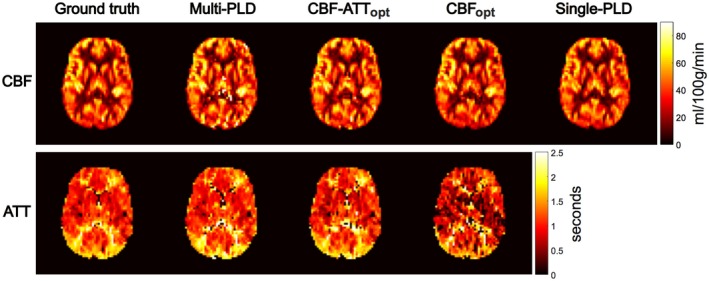
Representative CBF (top) and ATT (bottom) maps for the ground truth estimates and the 4 tested protocols. The maps show an axial slice from a single subject. Note there is no ATT map for the single‐PLD protocol

Representative CBF (top) and ATT (bottom) maps for the ground truth estimates and the 4 tested protocols. The maps show an axial slice from a single subject. Note there is no ATT map for the single‐PLD protocol