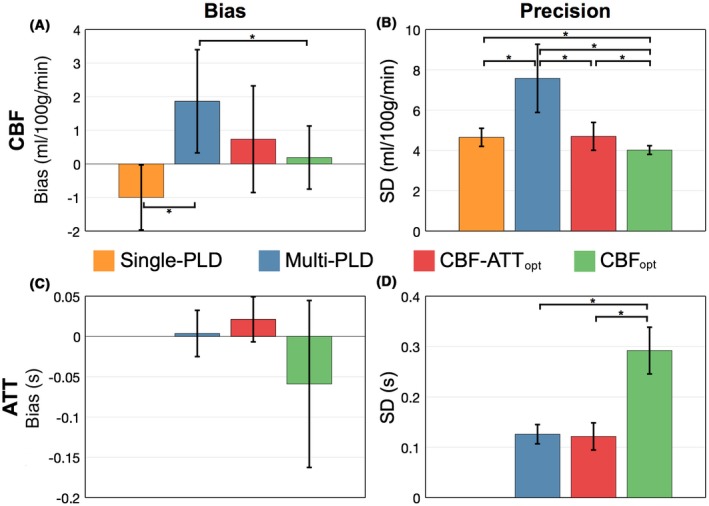
Figure 8.

In vivo CBF (top) and ATT (bottom) bias (A and C) and precision (B and D) across subjects. The height of each bar graph is the mean across subjects, whereas the error bar shows the SD across subjects. An asterisk (*) signifies significant differences using a non‐parametric paired test (Wilcoxon signed rank test), P < 0.05
