Abstract
Haematopoietic stem and progenitor cells (HSPCs) give rise to all blood lineages that support the entire lifespan of vertebrates1. After HSPCs emerge from endothelial cells within the developing dorsal aorta, homing allows the nascent cells to anchor in their niches for further expansion and differentiation2–5. Unique niche microenvironments, composed of various blood vessels as units of microcirculation and other niche components such as stromal cells, regulate this process6–9. However, the detailed architecture of the microenvironment and the mechanism for the regulation of HSPC homing remain unclear. Here, using advanced live imaging and a cell-labelling system, we perform high-resolution analyses of the HSPC homing in caudal haematopoietic tissue of zebrafish (equivalent to the fetal liver in mammals), and reveal the role of the vascular architecture in the regulation of HSPC retention. We identify a VCAM-1+ macrophage-like niche cell population that patrols the inner surface of the venous plexus, interacts with HSPCs in an ITGA4-dependent manner, and directs HSPC retention. These cells, named ‘usher cells’, together with caudal venous capillaries and plexus, define retention hotspots within the homing microenvironment. Thus, the study provides insights into the mechanism of HSPC homing and reveals the essential role of a VCAM-1+ macrophage population with patrolling behaviour in HSPC retention.
In vertebrates, the establishment of the HSPC pool is a dynamic process that requires not only the HSPC fate specification from the haemogenic endothelium, but also their subsequent homing to distinct anatomic sites2–5. In the zebrafish, HSPCs are initially formed in the ventral wall of the dorsal aorta in the aorta-gonad-mesonephros (AGM) region3,4. The nascent HSPCs then migrate to the caudal haematopoietic tissue (CHT) and kidney marrow, which are the haematopoietic tissues equivalent to mammalian fetal liver and bone marrow, respectively, where the HSPCs undergo rapid expansion and differentiation to support larval and adult haematopoiesis2,10. However, how HSPCs migrate to and finally colonize these tissues remains poorly understood.
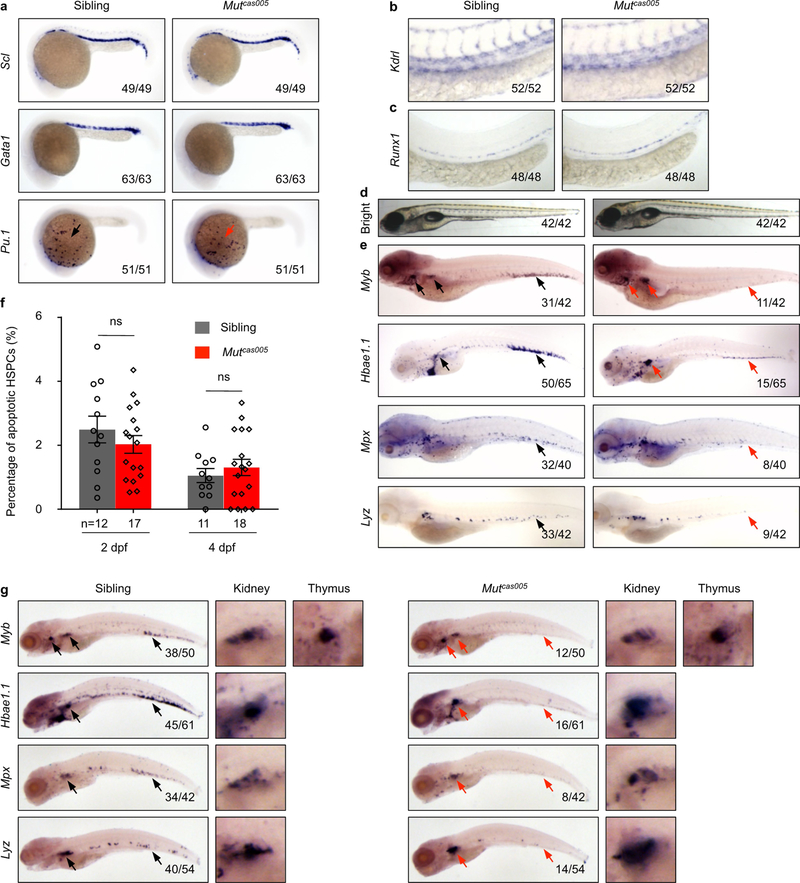
To investigate these unknown mechanisms, we carried out a large-scale forward genetics screen in zebrafish for mutants that display HSPC homing defects. The mutant line cas005 showed severe defects in definitive haematopoiesis, but normal primitive haematopoiesis and vascular morphogenesis (Extended Data Fig. 1a, b, e, g). Although the haemogenic endothelium in mutcas005 was intact, as revealed by whole-mount in situ hybridization (WISH) results of the nascent HSPC marker runx111 (a key transcription factor that regulates nascent HSPC emergence), the number of HSPCs in the mutant CHT was severely reduced (Extended Data Fig. 1c–e, g), without increased HSPC apoptosis (Extended Data Fig. 1f) compared to the wild-type CHT.
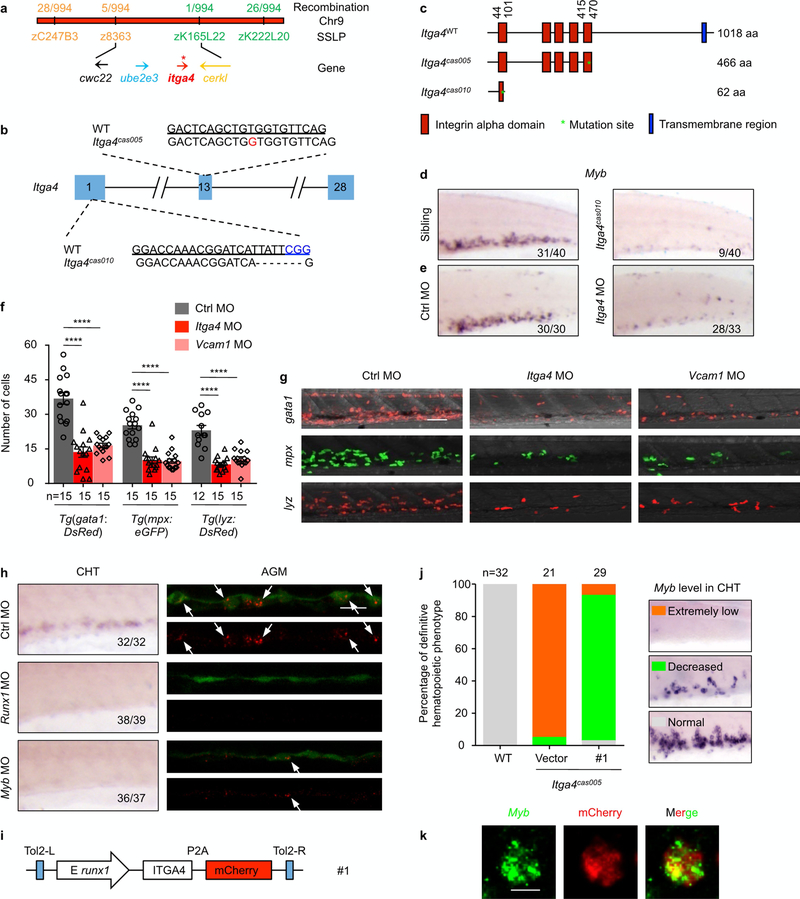
The genetic mutation was mapped to a loss-of-function mutation in the integrin alpha 4 (itga4) gene by positional cloning (Extended Data Fig. 2a–c). Indeed, morpholino-mediated knockdown of itga4 expression (Extended Data Fig. 2e–g) or a second zebrafish itga4cas010 mutant generated by CRISPR-Cas912 (Extended Data Fig. 2b–d) displayed similar phenotypes to that of mutcas00S, which was hence renamed as itga4cas005.
WISH analysis showed that itga4 expression was enriched in both the AGM and the CHT in a runx111- and myb13 (another key transcription factor that regulates nascent HSPC migration into circulation-dependent manner (Extended Data Fig. 2h). Conversely, runx1 enhancer14-directed definitive HSPC re-expression of wild-type itga4 could rescue the itga4 mutant defects (Extended Data Fig. 2i–k), indicating an HSPC cell-autonomous role of ITGA4.
The defective definitive haematopoiesis in zebrafish itga4 mutants is consistent with a previous report15. The VLA-4 integrin, composed of α4 (itga4) and β1 (itgb1) subunit, is predominantly expressed on HSPCs in mammals in early embryogenesis16. In mice, the a4 integrin is essential for normal haematopoietic development in the fetal liver15,17, and inhibition of α4 could mobilize HSPCs from fetal livers by interfering with the homing and retention process18,19. However, the precise mechanism by which IT GA4 regulates HSPC homing remains largely unknown.
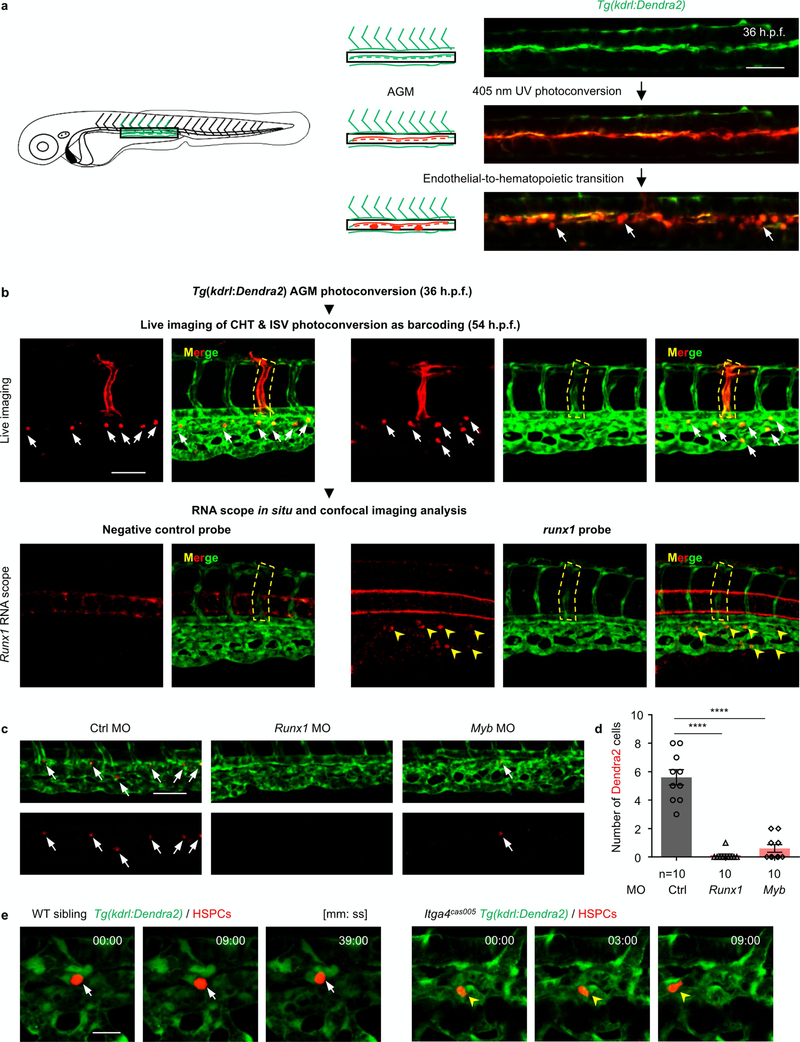
To achieve real-time characterization of HSPC homing to, and retention in, the CHT, we took advantage of the transgenic line Tg(kdrl:Dendra2), in which the kdrl gene promoter drives the expression of the photoconvertible Dendra2 fluorescent protein in the entire vasculature. At 36 hours post-fertilization (h.p.f.), we converted the green fluorescence of Dendra2+ endothelial cells in the AGM to red (Extended Data Fig. 3a). Consistent with previous reports3,4, a substantial number of endothelial cells converted by endothelial-to-haematopoietic transition emerged from the aortic ventral wall into the sub-aortic space, subsequently entered the blood circulation, and finally colonized the CHT by 48–50 h.p.f. (Extended Data Fig. 3a, b).
These photoconverted red Dendra2+ cells in the CHT were found to carry runx1 transcripts (Extended Data Fig. 3b). In addition, the knockdown of runx1 or myb expression13 significantly reduced the number of photoconverted red Dendra2+ cells in the CHT (Extended Data Fig. 3c, d). These results confirmed that the photoconverted red Dendra2+ cells homing to the CHT were nascent HSPCs.
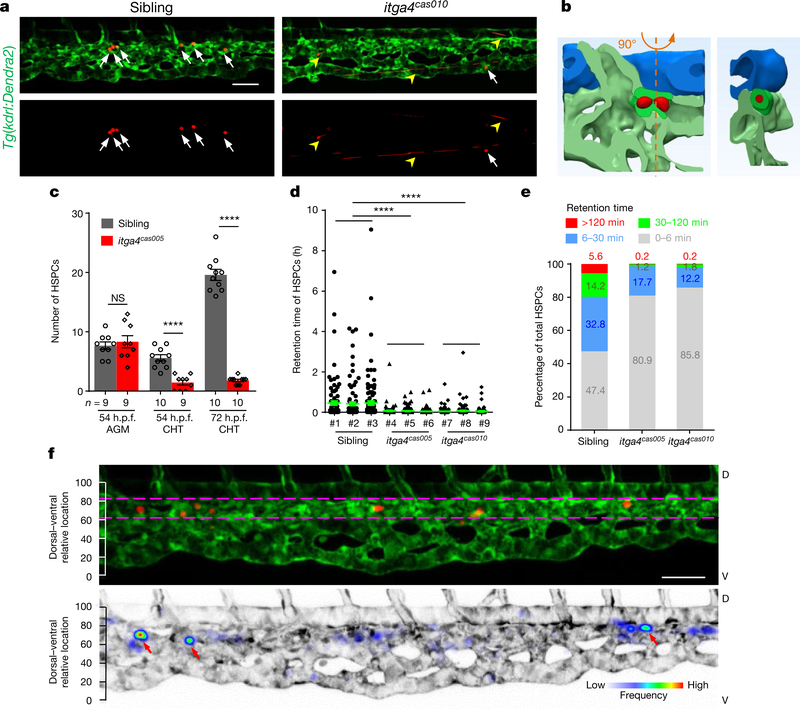
Thus, we were able to characterize the entire process and individual HSPC homing–retention events in the CHT. We found that the lodgement of HSPCs initially took place at approximately 48–50 h.p.f., and the number of lodged HSPCs markedly increased over 24 h. However, in the itga4-mutant embryos, HSPC retention was barely detectable (Fig. 1a, c and Supplementary Video 1). More specifically, the average retention time of HSPCs in wild-type embryos is close to 30 min, whereas the HSPCs in the itga4 mutants went through the CHT quickly with very short retention times (average retention time of 4 min) (Fig. 1d, e, Extended Data Fig. 3e and Supplementary Video 2). The functional consequence of the disrupted HSPC retention was markedly reduced downstream haematopoietic lineages (Extended Data Figs. 1e, g, 2f, g). We thus defined a successful HSPC retention event in the CHT as the lodgement of HSPCs for a period of more than 30 min (over 20% of HSPCs in the wild-type embryos, but less than 2% of HSPCs in the itga4 mutants).
Fig. 1 |. Live-imaging characterization of nascent HSPCs retention in the cHt.
a, Frame shots from the CHT at 54 h.p.f. show HSPCs seeding successfully (white arrows) in wild-type siblings but not in itga4cas010 mutants (fast moving, yellow arrowheads). See Supplementary Video 1. b, A representative vascular architecture view of the HSPC retention hotspot. The orthogonal view is shown on the right. HSPCs, red; dorsal aorta, blue; venous plexus, light green; venous capillary, dark green. See Supplementary Video 4. c, The number of HSPCs in the AGM and CHT ol itga4cas005 mutants and wild-type siblings at 54 and 72 h.p.f., respectively. 54 h.p.f. AGM: P = 0.59, t = 0.55, df = 16; 54 h.p.f. CHT: ****P < 0.0001, t = 6.00, df = 17; 72 h.p.f. CHT: ****P < 0.0001, t = 18.65, df = 18. NS, not significant. d, e, Retention time of individual HSPCs in each embryo (d) and percentage of total HSPCs in four classified retention time zones in group embryos (n = 3) (e) of wild-type siblings and itga4cas005 and itga4cas005 mutants during 50–60 h.p.f. Wild type vs itga4cas005: P < 0.0001, t = 8.56, df = 824; wild type vs itga4cas010: P < 0.0001, t = 7.93, df = 758. f, Top, HSPCs that remained for longer than 30 min were preferentially located in the region enriched with venous capillaries (between the two magenta dashed lines). Bottom, the frequency of the appearance of HSPCs in the entire CHT of Tg(kdrl:Dendra2) zebrafish larvae from 50 to 60 h.p.f. (retention hotspots marked by red arrows). D, dorsal; V, ventral. Scale bars, 50 μm (a, f).
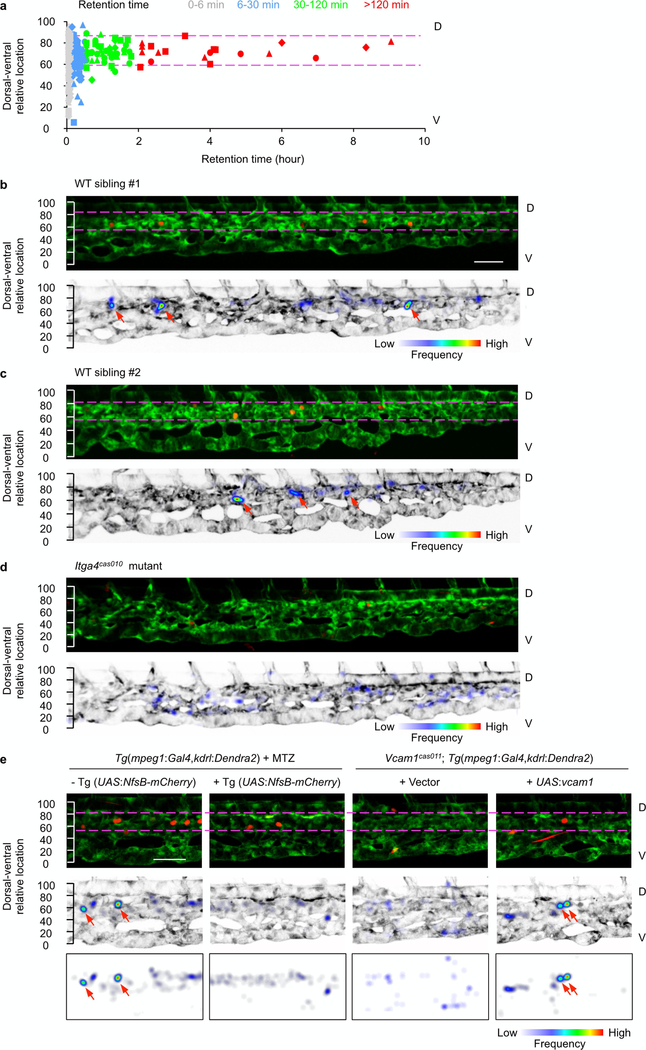
It has been proposed that HSPCs reside in the anatomically defined niche, where they receive and integrate regulatory signals from the niche cells and extracellular matrices6,7,20 for their expansion and differentiation. To understand the tendency of HSPC retention, we traced individual HSPCs and correlated their retention time with the dorsal-ventral relative location. This scatterplot analysis revealed that the longer HSPCs resided in the CHT, the greater was their tendency to reach the dorsal part of the caudal venous plexus (CVP) (Extended Data Fig. 4a). Next, we analysed the frequency of HSPCs’ appearance in the entire CHT over an 8-h time period. Unexpectedly, the retention of HSPCs was not evenly distributed in the dorsal part of the CVP, and instead the cells frequently occurred in several regions of the CHT in wild-type embryos. We referred to these regions as the retention ‘hotspots’ (Fig. 1f and Extended Data Fig. 4b, c).
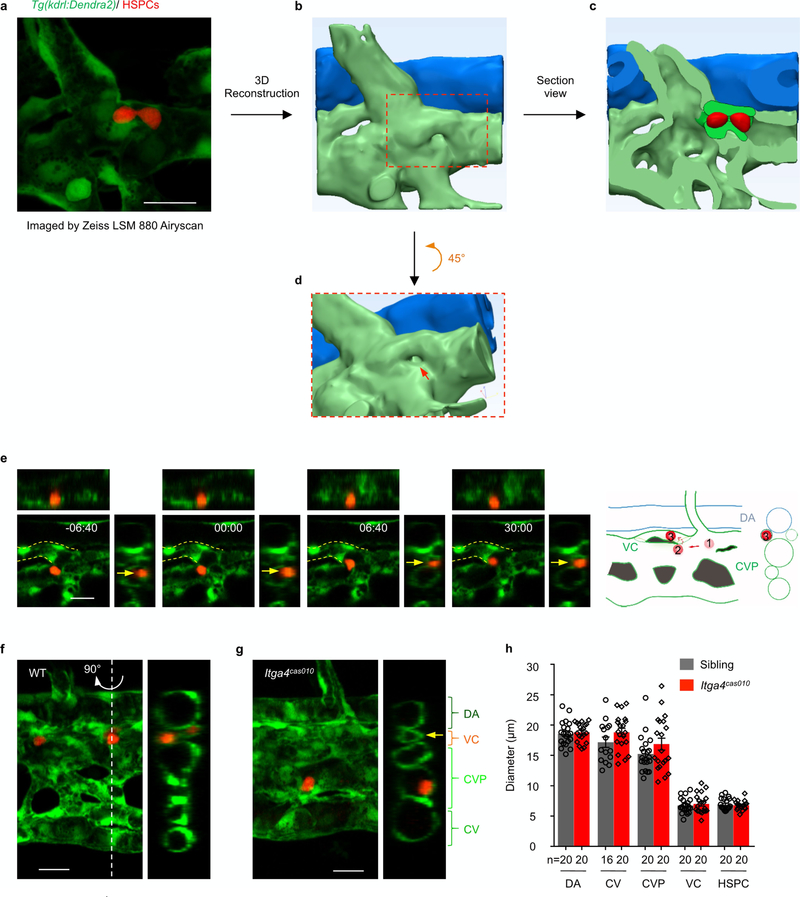
These retention hotspots are largely localized at the venous capillary confluence points that are connected to the CVP, in which the velocity of circulating photoconverted HSPCs is notably reduced (Extended Data Fig. 5a). HSPCs that entered the CHT either from the intersegmental vessel (ISV) or from the CVP (Extended Data Fig. 5b–e and Supplementary Video 3) were sharply decelerated. We also found that most HSPCs that remained for more than 30 min were in the venous capillaries, which have similar diameters to that of HSPCs (Fig. 1b, Extended Data Fig. 6a–f, h, Supplementary Video 4). In the itga4 mutants, the retention hotspots were not evident (Extended Data Fig. 4d). However, there was no significant difference in the number, size or confluence points of the vascular architecture between wildtype embryos and itga4 mutants (Extended Data Fig. 6g, h). These observations led us to hypothesize that other niche components might be needed for HSPCs to enter the venous capillaries in an ITGA4-dependent manner.
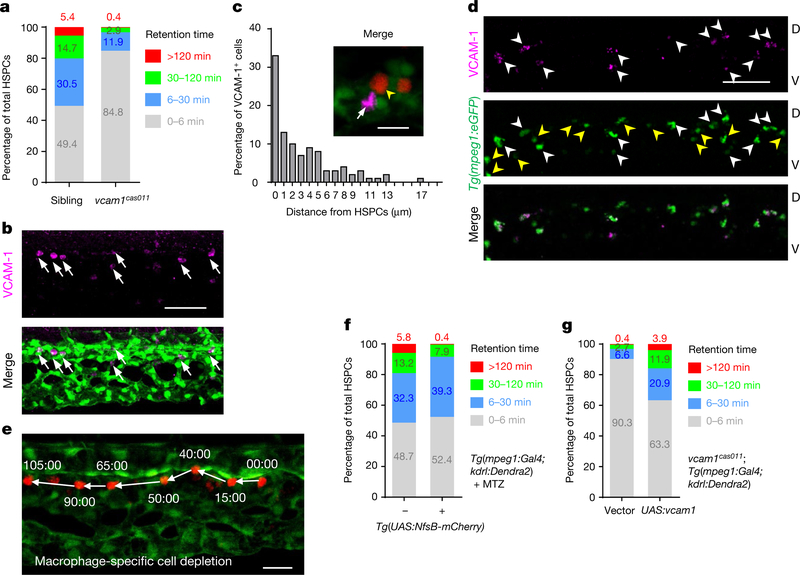
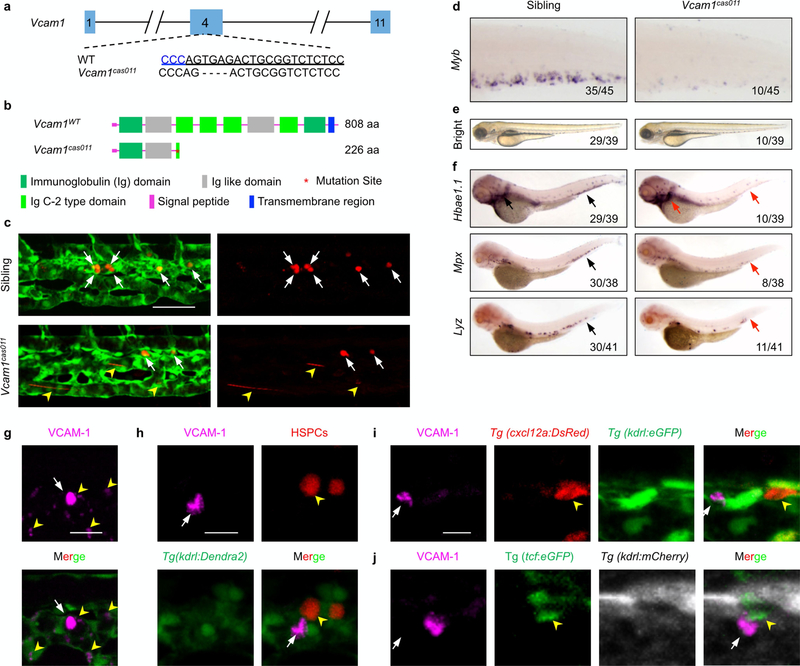
Vascular cell adhesion molecule-1 (VCAM-1) is known as the major ligand for VLA-4 in mammalian cells21,22. According to the ZFIN database (http://zfin.org/ZDB-GENE-070209–238), zebrafish vcam1 (also known as vcam1b) was specifically expressed in the cranial region, heart and the CHT at around 30 h.p.f. To evaluate the function of VCAM-1 in definitive haematopoiesis, we generated a vcam1cas011 mutant (Extended Data Fig. 7a, b). The mutants resembled the defects in homing and definitive haematopoiesis observed in the itga4 mutants (Fig. 2a, Extended Data Figs. 2f, g, 7c–f, Supplementary Video 5), indicating that the ITGA4-VCAM-1 axis has an evolutionarily conserved role in nascent HSPC homing and retention16,23.
Fig. 2 |. Distinct role of macrophages and venous endothelium VCAM-1 in HSPCs retention.
a, Percentage of total HSPCs in four classified retention time zones in grouped wild-type siblings and vcam1cas011 mutants (n = 3) at 50–60 h.p.f. b, Tg(kdrl:eGFP) embryos, stained with an anti-VCAM-1 antibody (magenta, arrows), show dorsal venous plexus distribution of individual VCAM-1+ cells in the CHT. c, Percentage of VCAM-1+ cells in the CHT scored by the distance to the nearest HSPC (edge to edge, n = 100). Most (86%; 86 out of 100 cells) VCAM-1+ cells were located within 7 μm of HSPCs (the average diameter of HSPCs is about 6.9 μm). Tg(kdrl:Dendra2) embryos with AGM photoconversion were stained with an anti-VCAM-1 antibody (magenta, white arrow). Yellow arrowheads denote HSPCs. d, The staining of Tg(mpeg1:eGFP) embryos with an anti-VCAM-1 antibody (magenta) shows that VCAM-1+ cells merge with mpeg1+ cells (green) in the CHT. White arrowheads denote VCAM-1+GFP+ double-positive cells; yellow arrowheads denote GFP single-positive cells. e, Live-imaging frame shots of HSPCs in macrophage-specific cell-depletion embryos from f. See Supplementary Video 6. Time is in minutes:seconds. f, Percentage of total HSPCs in four classified retention time zones in grouped (n = 3) Tg(mpeg1:Gal4,kdrl:Dendra2) embryos with MTZ treatment, with or without the Tg(UAS:NfsB-mCherry) background, at 50–60 h.p.f. g, Percentage of total HSPCs in four classified retention time zones in grouped (n = 3) vcam1cas011 mutants in a Tg(mpeg1:Gal4,kdrl:Dendra2) background with transient transgenesis of either vector (UAS:polyA) or UAS:vcam1 at 50–60 h.p.f. See Supplementary Video 6. Scale bars, 50 μm (b, d), 20 μm (e) and 10 μm (c).
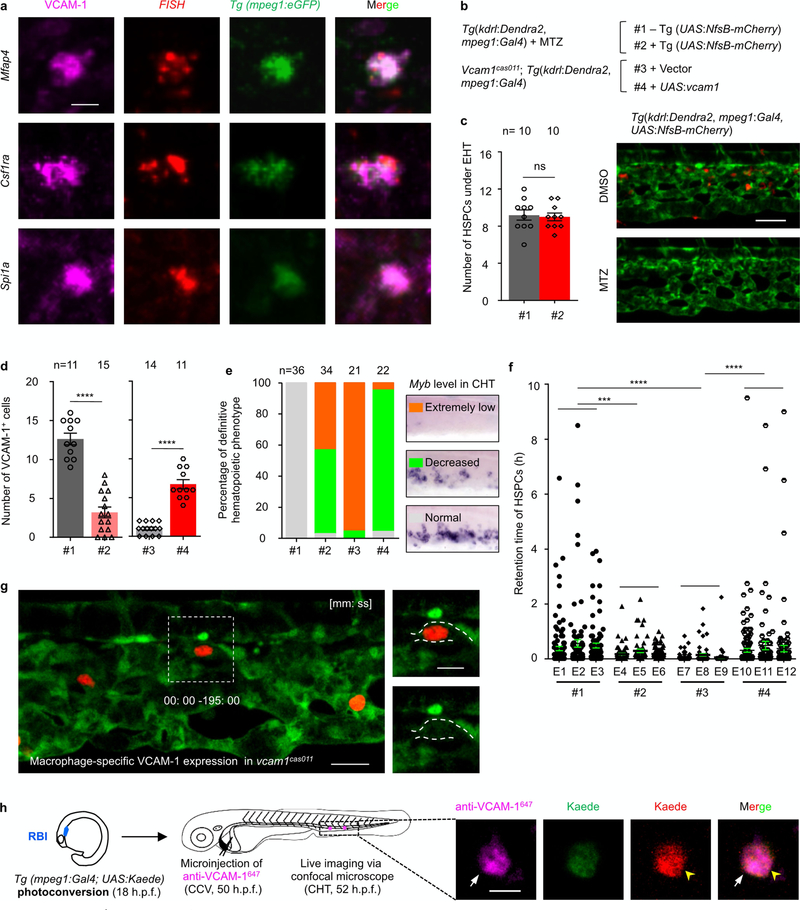
Immunofluorescence staining showed that endogenous VCAM-1 was strongly expressed on cells that are mostly distributed at the dorsal CVP, where HSPCs show preferential lodgement (Fig. 2b). In addition, VCAM-1 protein was also weakly expressed on some of the venous endothelial cells in the CHT (Extended Data Fig. 7g). Importantly, the VCAM-1+ non-endothelial cells in the CHT were always next to HSPCs (Fig. 2c, Extended Data Fig. 7h), which were neither previously described cxcl12a:DsRed+ cells nor somite-derived stromal reticular cells8,9(Extended Data Fig. 7i, j). By contrast, we found that almost all the VCAM-1+ non-endothelial cells were GFP+ in the macrophage-specific Tg(mpeg1:eGFP) transgenic line in the CHT (Fig. 2d). Meanwhile, about 45% of mpeg1+ cells in the CHT are VCAM-1+, and there are on average 13 VCAM-1+ macrophage-like cells per CHT (Extended Data Fig. 8d) that express the macrophage markers mfap4, csflra and spila with high overlapping rates (Extended Data Fig. 8a and Supplementary Table 2). Thus, these VCAM-1+ non-endothelial cells in the CHT are likely to be a subtype of macrophages.
To characterize the potential function of these VCAM-1+ macrophage-like cells in the homing and retention of HSPCs, we either depleted macrophages using metronidazole (MTZ) (loss-of-function analysis; Extended Data Fig. 8b–f), or transiently expressed wild-type vcaml in mpegl-positive macrophage cells in vcaml mutants (gain-of-function analysis; Extended Data Fig. 8b–g). MTZ depletion of macrophages did not affect HSPC emergence (Extended Data Fig. 8c), but caused impaired HSPC lodgement (Fig. 2e, f, Extended Data Fig. 8f) and defective definitive haematopoiesis (Extended Data Fig. 8e), indicating that macrophages are essential for HSPC retention. However, when the behaviour of HSPCs was compared with those of the vcam-1cas011 mutants, we found that although HSPCs in macrophage-depleted embryos did not successfully lodge in the CHT, they could flow slowly in the vasculature, suggesting that endothelial VCAM-1 might have a role in the initiation of HSPC rolling on the dorsal endothelium bed (Fig. 2e, Extended Data Figs. 4e, 8f and Supplementary Video 6), consistent with previous reports24.
The re-expression of vcaml exclusively in mpegl-positive cells could significantly restore HSPC retention (Fig. 2g, Extended Data Figs. 4e, 8e–g and Supplementary Video 6). The incomplete rescue of the retention phenotype suggests that the interaction of HSPCs with the CVP endothelium might also have a role by slowing down HSPCs to increase the chance for HSPC retention, even though the HSPC-CVP endothelium interaction is not absolutely required for HSPC retention.
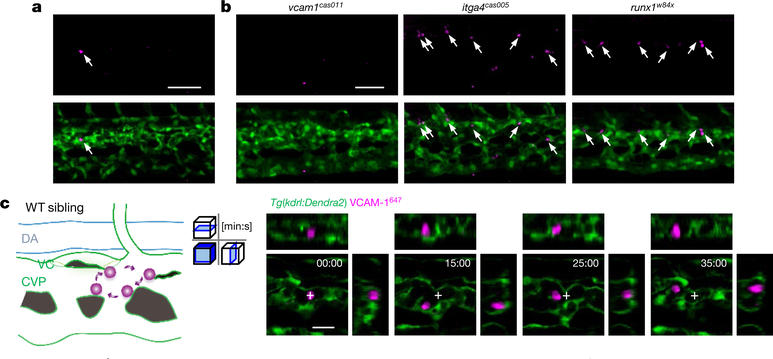
To determine when the VCAM-1+ macrophages appear in the CHT, we performed a time-course analysis of VCAM-1 expression from 28 to 48 h.p.f. The immunofluorescence results demonstrated that the VCAM-1+ macrophages first appeared in the CHT at 32 h.p.f. (Fig. 3a). The VCAM-1+ macrophages in the CHT were absent in the vcam1cas011 mutants and independent of HSPC deficiency in either itga4cas005 or runx1w84x mutants at 54 h.p.f. (Fig. 3b). Because the VCAM-1+ macrophages are present in the niche before the appearance of aorta-derived definitive HSPCs, these macrophages probably arise from the primitive macrophage lineage at this time point. We labelled the primitive macrophages by applying photoconversion on the Tg(mpeg1:Gal4,UAS:Kaede) line, and found that some macrophages from the rostral blood island25 at 18 h.p.f. migrated to the CHT, and were VCAM-1+ (Extended Data Fig. 8h).
Fig. 3 |. Characterization of VCAM-1+ macrophages in the CHT.
a, Transgenic Tg(kdrl:eGFP) embryos, stained with an anti-VCAM-1 antibody (magenta, arrows), show that the VCAM-1+ macrophage first appeared in the CHT at 32 h.p.f. b, Tg(kdrl:eGFP) embryos in the vcam1cas011, itga4cas005 or runx1w84x mutant background are stained with an anti-VCAM-1 antibody (magenta, white arrows) at 54 h.p.f. Signals in itga4cas005 and runx1w84x are similar to that in wild-type siblings, whereas there is almost no detectable signal in vcam1cas011 mutants. c, Schematic diagrams (left) and confocal imaging (right) of VCAM-1+ macrophages (labelled with Alexa Fluor 647 dye-conjugated anti-VCAM-1 antibody by intravascular injection) that patrol the CHT of wild-type embryos. VCAM-1+ macrophages were mainly located intravascularly (>91%) with round or unpolarized cell morphology (>84%). Cross indicates the original position of VCAM-1+ macrophages at the initial imaging time point. See Supplementary Video 7. DA, dorsal aorta; VC, venous capillaries. Scale bars, 50 μm (a, b) and 20 μm (c).
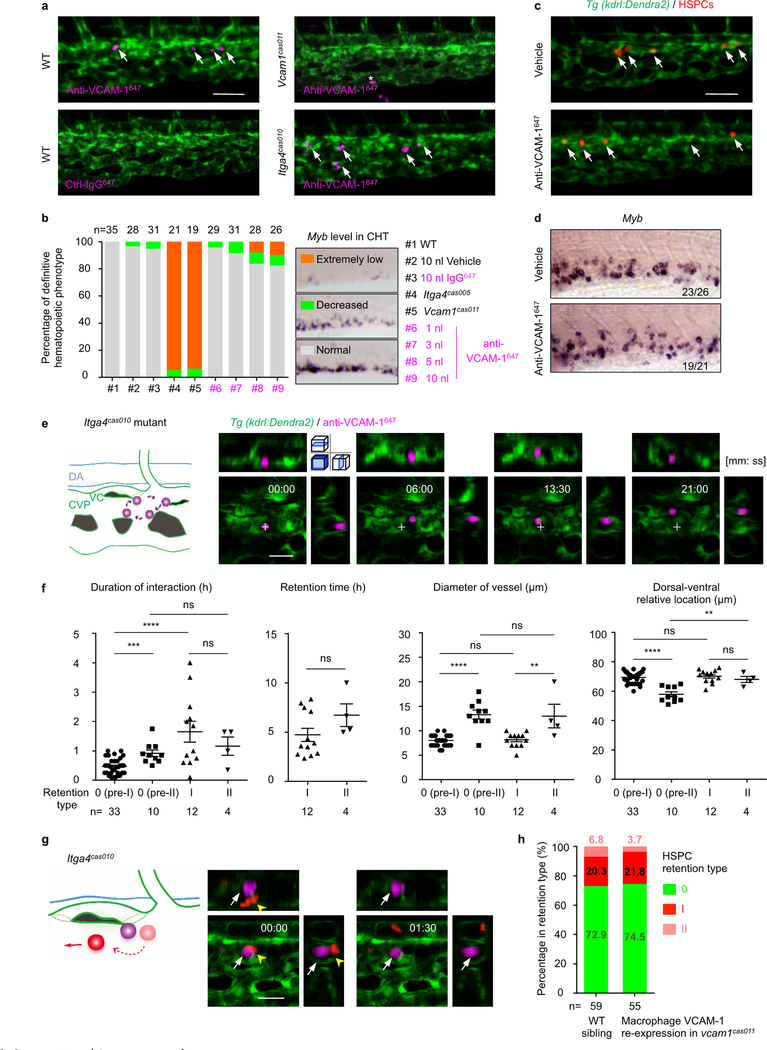
To characterize the behaviour and function of the VCAM-1+ macrophages in live animals further, we labelled VCAM-1+ macrophages with an anti-VCAM-1647 antibody. The live imaging showed a nearly identical cell distribution pattern to that revealed by anti-VCAM-1 immunofluorescence (Extended Data Fig. 9a). Live staining with the antibody remained stable for at least 8 h after intravascular antibody injection, without affecting definitive haematopoiesis, as demonstrated by quantitative myb WISH analysis (Extended Data Fig. 9b–d).
Notably, these VCAM-1+ macrophages slowly patrolled on the inner sides, especially the dorsal CVP (Fig. 3c, Extended Data Fig. 9e, Supplementary Video 7). HSPCs, entering from either the ISV or the CVP into the CHT, always pass by the capillary confluence point, which leads to frequent interactions of HSPCs with the VCAM-1+ macrophages.
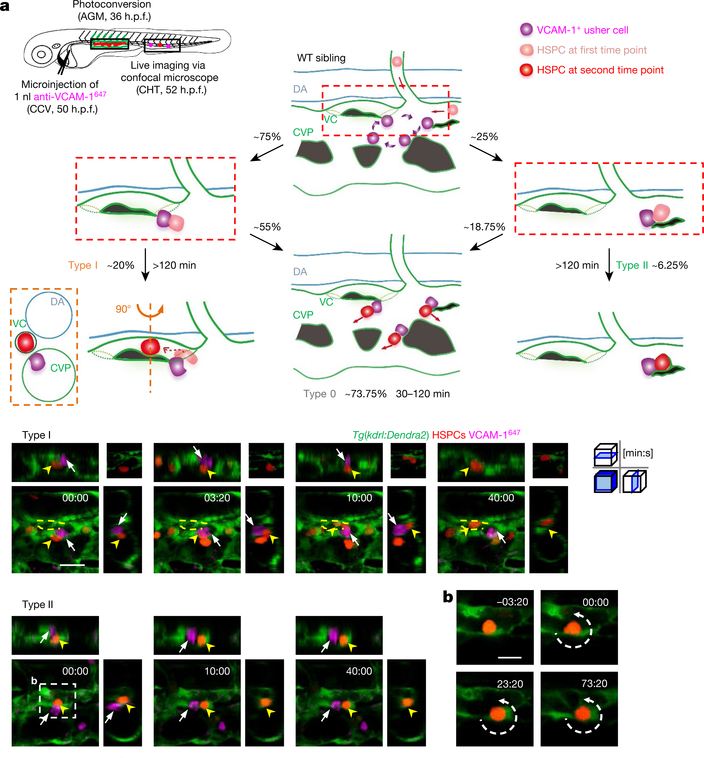
After quantitative analysis of more than 100 VCAM-1+ macrophage–HSPC interactions and subsequent events (Fig. 4a, Supplementary Table 3), we found that, on average, each interaction lasted approximately 30 min. About 60% of the HSPCs left the CHT through the venous plexus without retention (6–30 min), whereas around 40% of HSPCs could remain in the CHT for more than 30 min.
Fig. 4 |. Live imaging analysis on VCAM-1+ usher cell-guided HSPCs retention.
a, Schematic illustration (top left) shows that labelling of HSPCs (with photoconverted Dendra2, red) was performed at 36 h.p.f. in Tg(kdrl:Dendra2) embryos, followed by an anti-VCAM-1647 antibody injection at 50 h.p.f. Live imaging was performed 2 h after injection (52 h.p.f.). Schematic diagrams (top) show the HSPC retention model, with accurate percentage and classification. See Supplementary Table 3. Representative images (bottom) show the interaction between HSPCs (red; yellow arrowheads) and VCAM-1+ usher cells (magenta; white arrows). VCAM-1+ usher cells guide HSPCs into the venous capillaries, leading to type I and II retention (see Supplementary Videos 8 and 9). The top right images show one slice, and the others show z-stacks. b, Enlarged view of endothelial cell remodelling around a single HSPC to form a stem-cell pocket in type II retention (see Supplementary Video 9). Scale bars, 20 μm (a) and 10 μm (b).
Among these lodged HSPCs, about 75% interacted with VCAM-1+ macrophages at the entrance of dorsal venous capillaries. With the guidance of VCAM-1+ macrophages, 20% could finally enter the venous capillaries and remained for more than 120 min. We defined this as ‘type I’ retention (Fig. 4a, Extended Data Fig. 9f, Supplementary Video 8). Conversely, 25% of the lodged HSPCs interacted with VCAM-1+ macrophages within the CVP, and then 6.25% were surrounded by an ‘endothelial pocket’14 structure, leading to the ‘type II’ retention (Fig. 4a, b, Extended Data Fig. 9f, Supplementary Video 9). HSPCs that successfully interacted with VCAM-1+ macrophages (for more than 30 min) but failed to be guided into the vascular niche (55% as pre-type I and 18.75% as pre-type II retention) were termed ‘type 0’ retention. Notably, HSPCs have an increased chance of interacting with VCAM-1+ macrophages at venous capillary confluence points connected to the CVP where dorsal venous capillaries are also distributed and the hotspots of HSPCs retention were observed (Fig. 1f).
In itga4cas010 mutants, HSPCs encountered but did not interact with VCAM-1+ macrophages. They could not roll inside the vasculature, enter venous capillaries or be enveloped by endothelium. Instead, the HSPCs went quickly through the CHT (Extended Data Fig. 9g and Supplementary Video 10). Thus, the interaction mediated by ITGA4 and VCAM-1 has an essential role in HSPC homing and retention in the niche. Together with the feature that VCAM-1+ macrophages patrol at the dorsal CVP, we named these VCAM-1+ macrophages ‘usher’ cells. In addition, HSPCs retention in vcam1cas011 mutants with macrophage-specific vcam1 re-expression restored the occurrence of type II retention, indicating that the loss of vascular VCAM-1 is not sufficient to disrupt the vascular ‘cuddling’ structure (Extended Data Fig. 9h).
In this study, we mainly focused on the period of 48–60 h.p.f. at the initiation of HSPC homing because current imaging technology and transgenic lines do not allow the symmetry division to be distinguished from the asymmetry one, although most of the HSPC division in the CHT occurred in the vascular niche (66% in type I, 30% in type II retention). Morphology-based asymmetry division of HSPCs was previously reported in the vascular cuddling structure14; however, lineage-specific reporter lines with rapid responses are required in future studies to understand how the dynamic HSPC-niche interaction is coordinated with HSPC division.
We show that the behaviour of usher cells correlates with the retention of HSPCs in the CHT. It has been reported that macrophages promote the retention of HSPCs26,27. However, it is still not clear how the usher cells as well as niche cells express other molecules that recognize receptors on the HSPCs, serving as additional permissive signals for the entry of HSPCs into the niches. In addition, the itga4 mutant specifically impaired definitive haematopoiesis in the CHT, but not that in the thymus or kidney marrow, indicating different homing mechanisms might govern the lodgement of HSPCs into different niches (Extended Data Fig. 1e, g). Future studies are warranted to investigate these important questions.
METHODS
Zebrafish husbandry
The zebrafish facility and study were approved by the Animal Research Advisory Committee of Institute of Nutrition and Health, SIBS, CAS, and zebrafish were maintained according to the guidelines of the Institutional Animal Care and Use Committee. The Tubingen and WIK wild-type strains were used in this study. The runx1w84x mutant line28 and transgenic lines Tg(gata1:DsRed)29, Tg(mpx:eGFP)30, Tg(lyz:DsRed)31, Tg(kdrl:Dendra2)32, Tg(kdrl:eGFP)33, Tg(mpeg1 :Gal4, UAS:NfsB-mCherry)34, Tg( UAS:Kaede)35, Tg(cxcl12a:DsRed)8, Tg(tcf.eGFP)9‘36 and Tg(mpegl :eGFP)37 were described previously.
Genetic mapping and mutation identification of zebrafish cas005 mutant
The mut005 line was identified in a large-scale N-ethyl-N-nitrosourea (ENU) -mutagenized F2 family screen based on the myb expression phenotype of 5 days post-fertilization (d.p.f.) zebrafish embryos. The ENU screen and positional cloning were performed as described previously38. The mutation was mapped to chromosome 9 by bulk segregation analysis with sequence length polymorphism (SSLP) markers39. Fine mapping was carried out to narrow down the genetic interval, and the mutation was finally flanked by two SSLP markers, z8363 and zK165L22. The cDNAs of candidate genes in the range were cloned and sequenced from siblings and mutants, and the putative mutation was confirmed by sequencing genomic DNA of individual mutant embryos. All primers used for this study are provided in Supplementary Table 1.
Plasmid construction
The zebrafish vcam1 (also known as vcam1b, accession number: ZDB-GENE-070209–238) was cloned and inserted into the Tol2 backbone between the UAS promoter and polyA. The runx1 +23 enhancer followed by P2A and in-frame mCherry was cloned into the Tol2 backbone, and the zebrafish itga4 (accession number: ZDB-GENE-110411–108) was amplified and inserted between the runx1 enhancer and P2A.The sequences of vcam1 and itga4 were verified by sequencing. The runx1 +23 enhancer14 and UAS promoter40 were cloned as previously reported.
Microinjection and CRISPR–Cas9 mutagenesis
Morpholino oligonucleotides were designed and purchased from Gene Tools. The morpholino oligonucleotides used in this study give the same phenotypes as mutants. The itga4, runx141, myb13 and vcam1 morpholino oligonucleotides were injected into one-cell-stage embryos as previously described42. Transient transgenic constructs within Tol2 vectors (40 pg) were microinjected into one-cell-stage embryos with Tol2 transposase mRNA (40 pg)43. For CRISPR-Cas9-mediated generation of zebrafish mutants (itga4cas010 and vcam1cas011), guide RNAs (RNAs) were designed to target genes according to methods previously described44. The zebrafish codon-optimized Cas9 mRNA was synthesized from the pCS2-nCas9n plasmid (Addgene, plasmid47929)12 and gRNAs were in vitro synthesized using the MAXIscript T7 kit (Ambion). The gRNAs (100 pg) were microinjected into one-cell-stage embryos with Cas9 mRNA (300 pg).
Conventional WISH, FISH and RNA scope in situ analysis
The myb45, scl46, gata146, pu.146, kdrl45, runx147, hbae1.145, mpx45, lyz45, itga4, mfap448 and csf1ra48 probes were transcribed in vitro by T3 or T7 polymerase (Ambion) with Digoxigenin RNA Labelling Mix (Roche). Conventional and fluorescence whole-mount in situ hybridization (WISH and FISH) was described previously49. The penetrance of the indicated phenotype is shown in the bottom right of each panel (Extended Data Figs. 1a–e, g, 2d, e, h, 7d–f and 9d) and the embryos were genotyped after WISH and before phenotypic analysis (Extended Data Figs. 2d, j, k, 7d–f, 8e and 9b). Images of conventional WISH were mounted in 4% methylcellulose and captured by Olympus SZX16 microscope with Olympus DP80 CCD. In FISH and immunofluorescence double-staining, embryos were stained with cy3 or cy5 (TSA system, Perkin Elmer), followed by immunofluorescence, and then imaged by Zeiss LSM880 confocal microscope. RNA scope was conducted with probe runx1 (P/N: 433351, ACDBio) and negative control probe (REF: 320871, ACDBio). RNA scope procedure was performed as previously described50, and imaged by Olympus FV1000 Fluoview scanning confocal microscope. A list of oligonucleotides used to amplify these probes is provided in Supplementary Table 1.
Immunofluorescence staining and usher cell live immunolabelling
Immunofluorescence staining was performed as previously described51, with mouse anti-DsRed (Abcam), mouse anti-eGFP (Abmart), rabbit anti-VCAM-1 antibody (immunized by 180–300 amino acids of zebrafish VCAM-1 protein, Abclonal), AF488/546/647-conjugated secondary antibody (Life Technologies) and TUNEL assay kit (Roche). Images were collected using Olympus FV1000 Fluoview scanning confocal, Zeiss LSM710 confocal and Zeiss LSM880 confocal microscope and the embryos were genotyped following imaging analysis (Fig. 3b and Extended Data Fig. 8d). For live labelling of usher cells, VCAM-1 antibody (Abclonal) was conjugated with Alexa Fluor 647 dye and purified by Microscale Protein Labelling Kit (Invitrogen, A30009). Each embryo was injected 1 nl (0.4 ng) at the common cardinal vein into the circulation at 50 h.p.f. In vivo monitoring started from 2 h after injection and this live labelling is stable for more than 8 h52. Time-lapse intravital imaging was acquired by Zeiss LSM880 confocal microscope.
Inducible macrophage-specific cell depletion
As previously reported, MTZ-mediated cell depletion was performed on Tg(mpeg1:GAL4,UAS:NfsB-mCherry, kdrl:Dendra2)34,53 transgenic zebrafish embryos. Embryos from 24 to 60 h.p.f. were treated with freshly prepared 10 mM MTZ (Sigma) in 0.2% DMSO (dimethylsulfoxide) solution protected from light until the evaluation finished, then rinsed with embryo water three times.
Confocal microscope photoconversion and time-lapse live imaging analysis
The photoconversion of irreversible monomeric green-to-red fluorescent protein Dendra254,55 expressed following specific promoter was conducted with a 405-nm laser for 30 s by an Olympus FV1000 Fluoview scanning confocal microscope. For the HSPC labelling system, the ventral endothelium of dorsal aorta (between somites 8 and 17) of Tg(kdrl:Dendra2) embryos was exposed to a beam of405 nm ultraviolet (UV) laser light under a confocal microscope at 30–36 h.p.f. without affecting the normal endothelial-to-haematopoietic transition process, compared with that in untreated embryos4. The efficiency of cell labelling was confirmed under fluorescent microscope 8 h after photoconversion. The zebrafish with precise and bright photoconverted Dendra2 (red) cells were selected for further analysis. For the macrophage labelling system, the rostral blood island of Tg(mpeg1:Gal4,UAS:Kaede) zebrafish embryos was photoconverted at 18 h.p.f., followed by anti-VCAM-1647 injection at 50 h.p.f., and imaging at 52 h.p.f. using Zeiss LSM880 confocal microscope.
For time-lapse imaging, embryos were anaesthetized with 0.03% Tricaine (Sigma), and mounted in 1.5% low melting point agarose in a 60-mm dish. The embryos were scanned at 28.5 °C under an Olympus FV1000 Fluoview scanning confocal microscope with 20× water immersion objective, z-stalks were acquired with a step size of 3 μm within an interval of 3 min over several hours. To observe more details between HSPCs and vascular niche, images were collected using a Zeiss LSM880 confocal by 40 × water immersion objective; z-stalks were acquired with a size of 3 pm for over 8 h. The Zeiss LSM880 confocal allowed imaging of several embryos within a 2–5-min interval using a moving XY stage, as well as acquisition of z-stacks through the tissue in multiple channels. Note that 10 h is the maximum experimental duration of live-imaging analysis without phototoxicity. The embryos were genotyped following live-imaging analysis (Fig. 1a, c–e, 2a, e–g and Extended Data Figs. 3e, 4d, e, 6g, h, 7c, 8f, g, 9a, e, g, h).
Imaging data processing and rendering was performed in FV10-ASW 3.0 Viewer (Olympus), ZEN 2.1 (ZEISS), Imaris (Bitplane) and ImageJ (NIH). The retention time and location information that each HSPC appears in the CHT was exported by Imaris ‘Spots’ module and programmed by Python into retention heatmap (https://pypi.python.org/pypi/pyheatmap). The velocity of photoconverted HSPCs in the CHT was measured with the axial line scanning (ALS) as previously described56–58. Zeiss LSM880 equipped with Airyscan function was applied to capture high-resolution fluorescent images, followed with 3D reconstruction by Materialise software (including Mimics Medical and 3-matic Medical).
Statistical analysis
All statistical analysis was performed using Graphpad Prism 7 software using the two-tailed Student’s t-test. Centre values denote the mean, and error values denote s.e.m. (Fig. 1c and Extended Data Figs. 1f, 2f, 3d, 6h, 8c, d, 9f). The biologically independent sample size (n) was shown in the relevant figure panel (Fig. 1c and Extended Data Figs. 1f, 2f, j, 3d, 6h, 8c–e, 9b, f, h). All experiments in this study were repeated independently at least three times. For representative images, we have performed imaging on 5–10 embryos per independent experiments and repeated at least three times independently to find the most representative images (Figs. 1a, 2b–e, 3a–c, 4 and Extended Data Figs. 2k, 3e, 5a, c, d, 6e–g, 7c, g–j, 8a, c, g, h, 9a, c, e, g). The graphs in Fig. 1d and Extended Data Fig. 8f show individual values in three embryos per group separately. In Fig. 1f and Extended Data Fig. 4b–e, imaging was performed on one embryo per independent experiment, repeated three times independently, and three images were chosen for the analysis. ****P < 0.0001. No statistical methods were used to predetermine sample size. The experiments were not randomized, and investigators were not blinded to allocation during experiments and outcome assessment.
Reporting summary
Further information on research design is available in the Nature Research Reporting Summary linked to this paper.
Data availability
Any Methods, including any statements of data availability and Nature Research reporting summaries, along with any additional references and Source Data files, are available in the online version of the paper. 3D reconstruction of vessel surrounding HSPCs in retention hotspot is deposited at http://www.biosino.org/node/project/detail/OEP000169.
Extended Data
Extended Data Fig. 1 |. Phenotype characterization of zebrafish mutantcas005.
a, Normal primitive haematopoiesis is intact in mutcas005. WISH results demonstrate that the expression of primitive haematopoietic cell markers is identical between siblings and mutcas005 embryos at 22 h.p.f., including scl (also known as tal1; haematopoietic progenitor marker), gata1 (also known as gata1a; erythrocyte progenitor marker) and pu.1 (also known as spi1b; myeloid progenitor marker). b, The vascular development is normal in mutcas005 embryos. WISH results show no difference in the expression of kdrl (pan-endothelial cell marker) at 36 h.p.f. between wild-type siblings and mutcas005 embryos. c, The haemogenic endothelium is intact in mutcas005 embryos. WISH results show no difference in runx1 expression at 36 h.p.f. in wild-type and mutcas005 embryos. d, e, The definitive haematopoiesis is defective in zebrafish mutcas005 embryos. d, Bright-field images of wild-type and mutcas005 embryos show no obvious morphological difference at 5 d.p.f. e, WISH results of myb, hbae1.1, mpx and lyz expression in wild-type and mutcas005 embryos at 5 d.p.f. Arrows indicate the comparable position in wild-type (black) or mutcas005 embryos (red). In 5 d.p.f. wild-type embryos, myb was expressed in all haematopoietic tissues including the CHT, thymus and kidney, whereas homozygous mutcas005 embryos displayed markedly decreased myb expression in the CHT, but similar expression to wild-type embryos in the thymus and kidney marrow. In accordance, the expression of downstream haematopoietic lineage cell markers, including hbae1.1 (erythrocyte marker), mpx (granulocyte marker) and lyz (macrophage marker), also showed similar expression patterns in the wildtype (black) and mutcas005 (red) embryos to that of the myb WISH analysis. f, The percentage of apoptotic HSPCs detected by the TUNEL assay in 2 and 4 d.p.f. wild-type and mutcas005 embryos. 2 d.p.f.: P = 0.35, t = 0.96, df = 27; 4 d.p.f.: P = 0.50, t = 0.69, df = 27. Error bars denote s.e.m. g, At 7 d.p.f., myb expression in the thymus and kidney marrow was identical in wild-type sibling and mutcas005 embryos, whereas mutcas005 embryos still displayed markedly decreased myb expression in the CHT. In addition, mutcas005 embryos displayed notably decreased hbae1.1, mpx and lyz expression in the CHT but not in the kidney marrow.
Extended Data Fig. 2 |. Genetic mapping and verification of zebrafish itga4 mutants.
a, Positional cloning of mutcas005. After high-resolution mapping, the point mutation is flanked by the SSLP markers z8363 (5 recombinant out of 994 meiosis) and zK165L22 (1 recombinant out of 994 meiosis). This region contains the four genes cwc22, ube2e3, itga4 and cerkl. The red strip represents chromosome 9; the positions and recombination of the SSLP markers are indicated. SSLP markers on the same side of the mutation site are shown in the same colour. b, Generation of itga4 mutants via the ENU(top) or CRISPR-Cas9 (bottom) technique. The alignment of wild-type (underlined) and mutated sequences is listed. The insertion in ENU is indicated in red (an insertion of G leading to an earlier stop codon in the itga4 gene in mutcas005). The PAM sequence of gRNA is ‘CGG’ (blue). Deletions are indicated by dashes. c, According to the stop codon in the genome of itga4 mutants, SMART software was used to predict the structure of the wild-type itga4, itga4cas005 and itga4cas010 presumed protein. The molecular sizes of the presumed protein are indicated. d, The myb WISH results in wild-type and itga4cas010 embryos at 72 h.p.f. e, itga4 morphants could phenocopy itga4cas005. The validated itga4 morpholino oligonucleotide (MO) that can block the translation of itga4 mRNA was injected into one-cell-stage wild-type embryos to produce itga4 morphants. WISH results of myb expression in the control and itga4 morphants at 72 h.p.f. f, g, Representative live imaging (g) and statistical analysis (f) of Tg(gata1:DsRed), Tg(mpx:eGFP) and Tg(lyzDsRed) transgenic embryos after the injection of control or itga4 or vcam1 morpholino oligonucleotides at 84 h.p.f. Results show that downstream haematopoietic lineages were all defective owing to disrupted HSPC retention in the CHT. gata1, control vs itga4 MO: ****P < 0.0001, t = 7.42, df = 14; gata1, control vs vcam1 MO: ****P < 0.0001, t = 8.11, df = 14; mpx, control vs itga4 MO: P < 0.0001, t = 5.92, df = 14; mpx, control vs vcam1 MO: ****P < 0.0001, t = 9.41, df = 14; lyz, control vs itga4 MO: ****P < 0.0001, t = 7.16, df = 25; lyz, control vs vcam1 MO: ****P < 0.0001, t = 5.74, df = 25. h, In situ analysis of itga4 expression in the AGM (FISH, 36 h.p.f.) and CHT (WISH, 72 h.p.f.) of Tg(kdrl:eGFP) (green) embryos after injection of control, runx1 or myb morpholino oligonucleotides indicates HSPC cell-autonomous expression. i-k, itga4 has an HSPC intrinsic mechanism during definitive haematopoiesis. i, The construction of the plasmid that was applied in the itga4cas005 mutant for Tol2-transposase-mediated transient transgenesis of runx1-enhancer-driven wild-type itga4 expression. j, k, Phenotype analysis by myb WISH shows that the construct had a notable rescue effect on definitive haematopoiesis in the itga4cas005 mutant at 72 h.p.f. More than 45% of mCherry+ cells overlapped with myb FISH signalling in the CHT; a representative image is shown in k. Error bars denote s.e.m. Scale bars, 50 μm (g), 20 μm (h) and 5 μm (k).
Extended Data Fig. 3 |. Photoconversion of Tg(kdrl:Dendra2) cells in the AGM can specifically mark HSPCs in the CHT.
a, Schematic illustration (left) and confocal imaging analysis (right) of the HSPC labelling system in live Tg(kdrl:Dendra2) transgenic zebrafish larva. At 32–36 h.p.f., an ultraviolet laser was applied to photoconvert Dendra2 in haemogenic endothelium from green to red fluorescence in the area marked by the rectangle. Endothelial-to-haematopoietic transition was observed with egress of single red Dendra2+ cells (white arrows) from the aortic ventral wall into the sub-aortic space. b, Flow chart of the experimental analysis on HSPCs (red Dendra2+ cells) in live-imaging and confocal-imaging analysis after in situ RNA scope in identical locations. Green Dendra2 signalling could remain during the experiment, whereas red Dendra2 signalling could not (the red fluorescence of the ISV disappeared after in situ RNA scope analysis). Photoconverting the ISV in different embryos makes each embryo distinguishable. (We distinguished the embryos by the position of the photoconverted and weakened Dendra2 green ISV). After live imaging the red Dendra2+ cells in the CHT (top, arrows) at 54 h.p.f., the embryos were fixed immediately for runxl in situ RNA scope analysis (bottom, yellow arrowheads). All HSPCs (red Dendra2+ cells) carry runxl transcripts, whereas there was no signal in the negative control. c, d, Confocal images of the CHT (c) and statistical analysis (d) at 54 h.p.f. show markedly reduced numbers of HSPCs (red Dendra2+ cells) in runxl and myb morphants, compared to that in control morphants. Control vs runxl MO: ****P < 0.0001, t = 9.15, df = 9; control vs myb MO: ****P < 0.0001, t = 8.66, df = 9. e, Live-imaging analysis on individual HSPCs in wild-type and itga4cas005 mutant embryos. Three representative frames from time-lapse imaging of 52–60 h.p.f. wild-type and itga4cas005 embryos with the Tg(kdrl:Dendra2) labelling system. The HSPCs (white arrow) remained stable in the vascular niche for over 30 min in the wild-type sibling (left); however, in the itga4cas005 mutants (right), the HSPCs (yellow arrowhead) remained for less than 9 min (see Supplementary Video 2). Error bars represent s.e.m. Scale bars, 50 μm (a–c) and 20 μm (e).
Extended Data Fig. 4 |. The HSPCs’ retention ‘hotspot’ in the CHT.
a, Correlation analysis of retention time and the dorsal-ventral relative location of individual HSPCs in the CHT of four wild-type embryos at 50–60 h.p.f. Each shape represents one embryo (triangle, circle, square and rhombus), and each colour represent one class of retention time zone. HSPCs that remained for longer than 30 min were preferentially located in the region between the two magenta dashed lines enriched with venous capillaries. b–d, Longitudinal whole-mount images of the CHT in wild-type siblings (b, c) and itga4cas010 mutant embryos (d) in a Tg(kdrl:Dendra2) background after photoconversion and retention calculation of the frequency of HSPC appearance. e, Longitudinal whole-mount images of the CHT in Tg(mpeg1:Gal4,kdrl:Dendra2) embryos after MTZ treatment with or without a Tg(UASNfsB-mCherry) background, and vcam1cas011; Tg(mpeg1:Gal4,kdrl:Dendra2) embryos with transient transgenesis of vector (UAS:polyA) or UAS:vcam1 after photoconversion and retention calculation of the frequency of HSPC appearance. Red arrows denote retention hotspots. HSPCs were preferentially located in the region between the two magenta dashed lines. Retention hotspots disappeared in the itga4cas010and vcam1cas011 mutants after depletion of macrophages (MTZ treatment on NfsB-expressing macrophages). Scale bars, 50 μm.
Extended Data Fig. 5 |. HSPCs decelerate in the CHT vascular niche.
a, Representative spatial maps of the flow velocity of photoconverted HSPCs in the caudal vasculature at 54 h.p.f. Arrows show the direction of blood flow, and different colours indicate the level of velocity. b, Schematic illustration of how HSPCs enter the CHT via the circulation. c–e, Time-lapse imaging (c, d) and speed curve diagram (e) show that HSPCs arrive either from the intersegmental vessel (green arrow in c) or the CVP (red arrowhead in d) into the CHT and gradually decelerate (see Supplementary Video 3). Scale bar, 20 μm.
Extended Data Fig. 6 |. The representative high-resolution vascular structure and HSPC in the retention hotspot.
a, The original fluorescent image of the vessel surrounding HSPCs in the retention hotspot was captured by an LSM880 microscope equipped with Airyscan function and processed by 3D reconstruction (see Supplementary Video 4). b, 3D reconstruction of a. c, Section view of the caudal vein plexus and capillary. d, The 45° rotation view of the red frame in b. e, Time-lapse imaging (left) and scheme graph (right) show how HSPC retention occurs. HSPCs initially came into the venous plexus and then entered the venous capillary for long-term retention. f–h, Images (f, g) and statistical analysis (h) show that the diameter of various vessels in the CHT in itga4cas010 mutants (g) is similar to that in the wild-type siblings (f) at 54 h.p.f. The inner diameter of venous capillaries, but not other vessels, is close to the diameter of HSPCs. DA: P = 0.73, t = 0.35, df = 19; CV: P = 0.14, t = 1.52, df = 33; CVP: P = 0.17, t = 1.41, df = 19; VC: P = 0.63, t = 0.49, df = 19; HSPC: P = 0.67, t = 0.44, df = 19. Scale bar, 20 μm.
Extended Data Fig. 7 |. Characterization of VCAM-1+ cells in the CHT.
a, Generation of the vcaml mutant using the CRISPR-Cas9 technique. The alignment of wild-type (underlined) and mutated sequences is listed. The PAM sequence of gRNA is ‘GGG’ (in blue). Deletions are indicated by dashes. b, According to the stop codon in the genome, SMART software was used to predict the structure of the wild-type vcaml and vcam1cas011 presumed protein. The molecular sizes of the presumed protein are indicated. c, Live imaging of the CHT at 54 h.p.f. shows retention defects in vcam1cas011 mutants. Representative images show that most HSPCs resided within the CHT (white arrows) in wild-type siblings (top), whereas these cells went through quickly in vcam1cas011 embryos (bottom, yellow arrowheads) (see Supplementary Video 5). d, WISH analysis of myb expression in the CHT of wild-type and vcam1cas011 embryos at 72 h.p.f. e, f, The definitive haematopoiesis is defective in vcam1cas011 mutant zebrafish embryos. e, The bright-field images of wild-type and vcam1cas011 embryos show no obvious morphological difference at 72 h.p.f. f, WISH results of hbael.1, mpx and lyz expression in wild-type and vcam1cas011 mutant embryos at 72 h.p.f. Arrows indicate the comparable position in wild-type (black) or vcam1cas011 (red) embryos. g, Magnified views showed VCAM-1 was mainly expressed in individual cells (white arrow) but weakly expressed on the venous endothelial cells (yellow arrowheads). h, After photoconversion, Tg(kdrl:Dendra2) embryos are stained with anti-VCAM-1 (magenta, white arrow). The yellow arrowhead denotes an HSPC. i, Tg(cxcl12a:DsRed,kdrl:eGFP) transgenic embryos are stained with anti-VCAM-1 (magenta, white arrow) and anti-DsRed (red, yellow arrowhead). j, Tg(tcf:eGFP,kdrl:mCherry) transgenic embryos are stained with anti-VCAM-1 (magenta, white arrows) and anti-GFP (green, yellow arrowheads). Scale bars, 50 μm (c), 20 μm (g) and 10 μm (h, i).
Extended Data Fig. 8 |. Distinct role of macrophages and venous endothelium VCAM-1 in HSPCs retention.
a, Representative FISH confocal imaging of mfap4 (top), csf1ra (middle), spi1a (bottom) immunofluorescence with anti-VCAM-1 and anti-GFP antibodies indicates that VCAM-1+ cells in the CHT are macrophage-like cells (see Supplementary Table 2). b, The construction of the plasmid applied in c–f. c, Validation of the macrophage-specific cell-depletion system. Left, the number of HSPCs under the endothelial-to-haematopoietic transition (EHT) process in the AGM of Tg(mpeg1:Gal4,kdrl:Dendra2) transgenic embryos at 54 h.p.f. with MTZ treatment and with (#2) or without (#1) the Tg(UAS:NfsB-mCherry) background. P = 0.80, t = 0.25, df = 9. Right, live imaging of vessels (green) and macrophages (red) with or without MTZ treatment in the CHT of Tg(kdrl:Dendra2,mpeg1:Gal4,UAS :N fsB-mCherry) transgenic embryos showed that MTZ treatment could delete almost all mCherry+ macrophages. d, Quantification of VCAM-1+ cells in the CHT, detected by anti-VCAM-1 immunofluorescence, in Tg(mpeg1:Gal4,kdrl:Dendra2) embryos at 54 h.p.f. with MTZ treatment and with (#2) or without (#1) a Tg(UAS:NfsB-mCherry) background, and in vcam1cas011 mutants with Tol2-mediated transient transgenesis of vector (UAS:polyA) (#3) or UAS:vcam1 (#4) in a Tg(mpeg1:Gal4,kdrl:Dendra2) background. #1 vs #2: ****P < 0.0001, t = 9.18, df = 24; #3 vs #4: ****P < 0.0001, t = 10.03, df = 23. e, Statistical analysis shows the percentage of the three types of definitive haematopoietic phenotype (extremely low, decreased or normal) in the four experimental conditions (#1-#4) linked to d. Macrophage-specific cell depletion caused deficient definitive haematopoiesis; however, macrophage-specific VCAM-1 re-expression markedly rescued deficient haematopoiesis in vcam1cas011 mutants. f, Retention time of individual HSPCs in transgenic Tg(mpeg1:Gal4,kdrl:Dendra2) embryos at 50–60 h.p.f. with MTZ treatment and with (#2) or without (#1) a Tg(UAS:NfsB-mCherry) background, and in vcam1cas011 mutants with Tol2-mediated transient transgenesis of vector (UAS:polyA) (#3) or UAS:vcam1 (#4) in a Tg(mpeg1:Gal4,kdrl:Dendra2) background (see Fig. 2f, g). #1 vs #2: ***P = 0.0001, t = 3.85, df = 550; #1 vs #3: ****P < 0.0001, t = 6.05, df = 565; #3 vs #4: ****P < 0.0001, t = 4.37, df = 590. g, Live-imaging frame shots of HSPCs in which macrophage-specific VCAM-1 was in re-expressed vcam1cas011 mutants from Fig. 2g (see Supplementary Video 6). h, Schematic illustration shows that macrophage labelling (photoconverted Kaede+; red) was performed at 18 h.p.f. in the rostral blood island (RBI) in Tg(mpeg1:Gal4, UAS:Kaede) embryos, followed by a 1 nl anti-VCAM-1647 (0.4 ng) antibody injection at 50 h.p.f. Cell-lineage tracing of the labelled macrophages (red; yellow arrowheads) in vivo was performed from 2 h after the injection. Representative images show that macrophages from the rostral blood island at 18 h.p.f. migrate to the CHT, and are VCAM-1+. Scale bars, 50 μm (c), 20 μm (g), 10 μm (h) and 5 μm (a).
Extended Data Fig. 9 |. Anti-VCAM-1647 antibody labels usher cells without disrupting definitive haematopoiesis.
a, Injection of 1 nl (0.4 ng) of anti-VCAM-1647 antibody labels usher cells (arrows) in wildtype and itga4cas010 mutants in the Tg(kdrl:eGFP) background, whereas injection of either control (non-specific) IgG647 antibody into wildtype cells or anti-VCAM-1647 antibody into vcam1cas011 mutants in the Tg(kdrl:eGFP) background did not label any cells in the retention hotspots. Asterisk indicates nonspecific labelling on a chromatophore in the CHT. b, Anti-VCAM-1647 injection marginally influence definitive haematopoiesis. Statistical analysis shows the percentage of the three types of definitive haematopoietic phenotype in nine different conditions, including wild-type embryos without injection (#1), with 10 nl vehicle (#2) or 10 nl 0.4 mg ml−1 IgG647 injection (#3), itga4cas005 mutants (#4) or vcam1cas011 mutants (#5) without injection, and wild-type embryos with 1–10 nl 0.4 mg ml−1 anti-VCAM-1647 injection (#6-#9). c, d, Live imaging of HSPCs (c) or WISH analysis of the myb probe at 60 h.p.f. (d) of the wild-type CHT after vehicle or 1 nl anti-VCAM-1647 antibody injection. e, Schematic diagrams (left) and confocal imaging (right) show VCAM-1+ cells patrolling on a small scale in the CHT in itga4cas010 mutant embryos. Cross indicates the original position at the initial time point. f, Statistical analysis of the duration of the interaction between HSPCs and usher cells, the HSPC retention time, the diameter of vessels and the dorsal-ventral relative location for HSPC retention in pre-type I (type 0), pre-type II (type 0), type I and type II. Duration, pre-I vs pre-II: ***P = 0.0001, t = 4.25, df = 41; duration, pre-I vs I: ****P< 0.0001, t = 5.31, df = 43; duration, pre-II vs II: P = 0.37, t = 0.93, df = 12; duration, I vs II: P = 0.46, t = 0.76, df = 14; retention: P = 0.16, t = 1.50, df = 14; diameter, pre-I vs pre-II: ****P < 0.0001, t = 8.80, df = 41; diameter, pre-I vs I: P = 0.68, t = 0.42, df = 43; diameter, pre-II vs II: P = 0.89, t = 0.14, df = 12; diameter, I vs II: **P = 0.006, t = 3.24, df = 14; location, pre-I vs pre-II: ****P < 0.0001, t = 7.64, df = 41; location, pre-I vs I: P = 0.6, t = 0.53, df = 43; location, pre-II vs II: **P = 0.005, t = 3.41, df = 12; location, I vs II: P = 0.41, t = 0.85, df = 14. g, In itga4cas010 mutants, HSPCs encountered but failed to interact with usher cells and then went through the CHT within a few minutes (see Supplementary Video 10). h, The percentage of the type 0, type I and type II HSPC retention types in wild-type sibling and vcam1cas011 mutants in the Tg(mpeg1:Gal4,kdrl:Dendra2) background with transient transgenesis of UAS:vcam1. None of the HSPCs in the vcam1 mutants could be classified into either type I or II retention types, or were comparable with the HSPCs in Extended Data Fig. 8h. Scale bars, 50 μm (a, c) and 20 μm (e, g).
Supplementary Material
Acknowledgements
We thank the following people for the zebrafish transgenic lines: L. Luo for Tg(kdrl:Dendra2), Z. Wen for Tg(mpeg1:Gal4,UAS:NfsB-mCherry), Tg(UASKaede) and Tg(mpeg1:eGFP), B. Blazar for Tg(cxcl12a:dsRed) and F. Argenton for Tg(tcf:eGFP). We are also grateful to M. Deng and J. He for technical support, and Z. Wen, L. Li, L. Zon, J. Peng and A. Meng for discussions. This work was granted by CAS Strategic Priority Research Program (XDB19030000), Ministry of Science and Technology of China (2017YF0503600), National Natural Science Foundation of China (31571505 and 31371461), CAS Scientific Research Equipment Development Project (YZ201646) and Science and Technology Commission of Shanghai Municipality (13JC1406400) to W.J.P.
Footnotes
Competing interests The authors declare no competing interests.
Online content
Any methods, additional references, Nature Research reporting summaries, source data, statements of data availability and associated accession codes are available at https://doi.org/10.1038/s41586–018-0709–7.
Additional information
Extended data is available for this paper at https://doi.org/10.1038/s41586-018-0709-7.
Supplementary information is available for this paper at https://doi.org/10.1038/s41586-018-0709-7.
Publisher’s note: Springer Nature remains neutral with regard to jurisdictional claims in published maps and institutional affiliations.
References
- 1.Morrison SJ, Uchida N & Weissman IL The biology of hematopoietic stem cells. Annu. Rev. Cell Dev. Biol 11, 35–71 (1995). [DOI] [PubMed] [Google Scholar]
- 2.Murayama E et al. Tracing hematopoietic precursor migration to successive hematopoietic organs during zebrafish development. Immunity 25, 963–975 (2006). [DOI] [PubMed] [Google Scholar]
- 3.Kissa K & Herbomel P Blood stem cells emerge from aortic endothelium by a novel type of cell transition. Nature 464, 112–115 (2010). [DOI] [PubMed] [Google Scholar]
- 4.Bertrand JY et al. Haematopoietic stem cells derive directly from aortic endothelium during development. Nature 464,108–111 (2010). [DOI] [PMC free article] [PubMed] [Google Scholar]
- 5.Boisset JC et al. In vivo imaging of haematopoietic cells emerging from the mouse aortic endothelium. Nature 464, 116–120 (2010). [DOI] [PubMed] [Google Scholar]
- 6.Xue Y et al. The vascular niche regulates hematopoietic stem and progenitor cell lodgment and expansion via klf6a-ccl25b. Dev. Cell 42, 349–362.e4 (2017). [DOI] [PubMed] [Google Scholar]
- 7.Mahony CB, Fish RJ, Pasche C & Bertrand JY tfec controls the hematopoietic stem cell vascular niche during zebrafish embryogenesis. Blood 128, 1336–1345 (2016). [DOI] [PubMed] [Google Scholar]
- 8.Glass TJ et al. Stromal cell-derived factor-1 and hematopoietic cell homing in an adult zebrafish model of hematopoietic cell transplantation. Blood 118, 766–774 (2011). [DOI] [PMC free article] [PubMed] [Google Scholar]
- 9.Murayama E et al. NACA deficiency reveals the crucial role of somite-derived stromal cells in haematopoietic niche formation. Nat. Commun 6, 8375 (2015). [DOI] [PubMed] [Google Scholar]
- 10.Jin H, Xu J & Wen Z Migratory path of definitive hematopoietic stem/progenitor cells during zebrafish development. Blood 109, 5208–5214 (2007). [DOI] [PubMed] [Google Scholar]
- 11.Burns CE, Traver D, Mayhall E, Shepard JL & Zon LI Hematopoietic stem cell fate is established by the Notch-Runx pathway. Genes Dev. 19, 2331–2342 (2005). [DOI] [PMC free article] [PubMed] [Google Scholar]
- 12.Jao LE, Wente SR & Chen W Efficient multiplex biallelic zebrafish genome editing using a CRISPR nuclease system. Proc. Natl Acad. Sci. USA 110, 13904–13909 (2013). [DOI] [PMC free article] [PubMed] [Google Scholar]
- 13.Soza-Ried C, Hess I, Netuschil N, Schorpp M & Boehm T Essential role of c-myb in definitive hematopoiesis is evolutionarily conserved. Proc. Natl Acad. Sci. USA 107, 17304–17308 (2010). [DOI] [PMC free article] [PubMed] [Google Scholar]
- 14.Tamplin OJ et al. Hematopoietic stem cell arrival triggers dynamic remodeling of the perivascular niche. Cell 160, 241–252 (2015). [DOI] [PMC free article] [PubMed] [Google Scholar]
- 15.Arroyo AG, Yang JT, Rayburn H & Hynes RO a4 integrins regulate the proliferation/differentiation balance of multilineage hematopoietic progenitors in vivo. Immunity 11, 555–566 (1999). [DOI] [PubMed] [Google Scholar]
- 16.Imai Y, Shimaoka M & Kurokawa M Essential roles of VLA-4 in the hematopoietic system. Int. J. Hematol. 91, 569–575 (2010). [DOI] [PubMed] [Google Scholar]
- 17.Gribi R, Hook L, Ure J & Medvinsky A The differentiation program of embryonic definitive hematopoietic stem cells is largely a4 integrin independent. Blood 108, 501–509 (2006). [DOI] [PubMed] [Google Scholar]
- 18.Qian H et al. Distinct roles of integrins a6 and a4 in homing of fetal liver hematopoietic stem and progenitor cells. Blood 110, 2399–2407 (2007). [DOI] [PubMed] [Google Scholar]
- 19.Scott LM, Priestley GV & Papayannopoulou T Deletion of α4 integrins from adult hematopoietic cells reveals roles in homeostasis, regeneration, and homing. Mol. Cell. Biol 23, 9349–9360 (2003). [DOI] [PMC free article] [PubMed] [Google Scholar]
- 20.Nombela-Arrieta C et al. Quantitative imaging of haematopoietic stem and progenitor cell localization and hypoxic status in the bone marrow microenvironment. Nat. Cell Biol. 15, 533–543 (2013). [DOI] [PMC free article] [PubMed] [Google Scholar]
- 21.Osborn L et al. Direct expression cloning of vascular cell adhesion molecule 1, a cytokine-induced endothelial protein that binds to lymphocytes. Cell 59, 1203–1211 (1989). [DOI] [PubMed] [Google Scholar]
- 22.Elices MJ et al. VCAM-1 on activated endothelium interacts with the leukocyte integrin VLA-4 at a site distinct from the VLA-4/fibronectin binding site. Cell 60, 577–584 (1990). [DOI] [PubMed] [Google Scholar]
- 23.Koenig JM, Ballantyne CM, Kumar AG, Smith CW & Yoder MC Vascular cell adhesion molecule-1 expression and hematopoietic supportive capacity of immortalized murine stromal cell lines derived from fetal liver and adult bone marrow. In Vitro Cell. Dev. Biol. Anim 38, 538–543 (2002). [DOI] [PubMed] [Google Scholar]
- 24.Berlin C et al. a4 integrins mediate lymphocyte attachment and rolling under physiologic flow. Cell 80, 413–422 (1995). [DOI] [PubMed] [Google Scholar]
- 25.Warga RM, Kane DA & Ho RK Fate mapping embryonic blood in zebrafish: multi- and unipotential lineages are segregated at gastrulation. Dev. Cell 16, 744–755 (2009). [DOI] [PMC free article] [PubMed] [Google Scholar]
- 26.Winkler IG et al. Bone marrow macrophages maintain hematopoietic stem cell (HSC) niches and their depletion mobilizes HSCs. Blood 116, 4815–4828 (2010). [DOI] [PubMed] [Google Scholar]
- 27.Dutta P et al. Macrophages retain hematopoietic stem cells in the spleen via VCAM-1. J. Exp. Med 212, 497–512 (2015). [DOI] [PMC free article] [PubMed] [Google Scholar]
- 28.Jin H et al. Definitive hematopoietic stem/progenitor cells manifest distinct differentiation output in the zebrafish VDA and PBI. Development 136, 647–654 (2009). [DOI] [PMC free article] [PubMed] [Google Scholar]
- 29.Traver D et al. Transplantation and in vivo imaging of multilineage engraftment in zebrafish bloodless mutants. Nat. Immunol 4, 1238–1246 (2003). [DOI] [PubMed] [Google Scholar]
- 30.Shi X et al. Functions of idhl and its mutation in the regulation of developmental hematopoiesis in zebrafish. Blood 125, 2974–2984 (2015). [DOI] [PubMed] [Google Scholar]
- 31.Hall C, Flores MV, Storm T, Crosier K & Crosier P The zebrafish lysozyme C promoter drives myeloid-specific expression in transgenic fish. BMC Dev. Biol 7 42 (2007). [DOI] [PMC free article] [PubMed] [Google Scholar]
- 32.Liu C et al. Macrophages mediate the repair of brain vascular rupture through direct physical adhesion and mechanical traction. Immunity 44, 1162–1176 (2016). [DOI] [PubMed] [Google Scholar]
- 33.Cross LM, Cook MA, Lin S, Chen JN & Rubinstein AL Rapid analysis of angiogenesis drugs in a live fluorescent zebrafish assay. Arterioscler. Thromb. Vasc. Biol 23, 911–912 (2003). [DOI] [PubMed] [Google Scholar]
- 34.Davison JM et al. Transactivation from Gal4-VP16 transgenic insertions for tissue-specific cell labeling and ablation in zebrafish. Dev. Biol 304, 811–824 (2007). [DOI] [PMC free article] [PubMed] [Google Scholar]
- 35.Scott EK & Baier H The cellular architecture of the larval zebrafish tectum, as revealed by Gal4 enhancer trap lines. Front. Neural Circuits 3, 13 (2009). [DOI] [PMC free article] [PubMed] [Google Scholar]
- 36.Moro E et al. In vivo Wnt signaling tracing through a transgenic biosensor fish reveals novel activity domains. Dev. Biol 366, 327–340 (2012). [DOI] [PubMed] [Google Scholar]
- 37.Ellett F, Pase L, Hayman JW, Andrianopoulos A & Lieschke GJ mpegl promoter transgenes direct macrophage-lineage expression in zebrafish. Blood 117, e49–e56 (2011). [DOI] [PMC free article] [PubMed] [Google Scholar]
- 38.Bahary N et al. The Zon laboratory guide to positional cloning in zebrafish. Methods Cell Biol. 77, 305–329 (2004). [DOI] [PubMed] [Google Scholar]
- 39.Knapik EW et al. A microsatellite genetic linkage map for zebrafish (Danio rerio). Nat. Genet 18, 338–343 (1998). [DOI] [PubMed] [Google Scholar]
- 40.Scheer N & Campos-Ortega JA Use of the Gal4-UAS technique for targeted gene expression in the zebrafish. Mech. Dev 80, 153–158 (1999). [DOI] [PubMed] [Google Scholar]
- 41.Lam EYN et al. Zebrafish runxl promoter-EGFP transgenics mark discrete sites of definitive blood progenitors. Blood 113, 1241–1249 (2009). [DOI] [PubMed] [Google Scholar]
- 42.Nasevicius A & Ekker SC Effective targeted gene ‘knockdown’ in zebrafish. Nat. Genet 26, 216–220 (2000). [DOI] [PubMed] [Google Scholar]
- 43.Suster ML, Kikuta H, Urasaki A, Asakawa K & Kawakami K Transgenesis in zebrafish with the Tol2 transposon system. Methods Mol. Biol 561, 41–63 (2009). [DOI] [PubMed] [Google Scholar]
- 44.Xiao A et al. Chromosomal deletions and inversions mediated by TALENs and CRISPR/Cas in zebrafish. Nucleic Acids Res. 41, e141 (2013). [DOI] [PMC free article] [PubMed] [Google Scholar]
- 45.Gao L et al. TopBP1 governs hematopoietic stem/progenitor cells survival in zebrafish definitive hematopoiesis. PLoS Genet. 11, e1005346 (2015). [DOI] [PMC free article] [PubMed] [Google Scholar]
- 46.Patterson LJ et al. The transcription factors Scl and Lmo2 act together during development of the hemangioblast in zebrafish. Blood 109, 2389–2398 (2007). [DOI] [PubMed] [Google Scholar]
- 47.Jia XE et al. Mutation of krill causes definitive hematopoiesis failure via PERK-dependent excessive autophagy induction. Cell Res. 25, 946–962 (2015). [DOI] [PMC free article] [PubMed] [Google Scholar]
- 48.Zakrzewska A et al. Macrophage-specific gene functions in Spi1-directed innate immunity. Blood 116, e1–e11 (2010). [DOI] [PubMed] [Google Scholar]
- 49.Jowett T & Lettice L Whole-mount in situ hybridizations on zebrafish embryos using a mixture of digoxigenin- and fluorescein-labelled probes. TIG 10, 73–74 (1994). [DOI] [PubMed] [Google Scholar]
- 50.Wang H et al. Dual-color ultrasensitive bright-field RNA in situ hybridization with RNAscope. Methods Mol. Biol 1211, 139–149 (2014). [DOI] [PubMed] [Google Scholar]
- 51.Murphey RD, Stern HM, Straub CT & Zon LI A chemical genetic screen for cell cycle inhibitors in zebrafish embryos. Chem. Biol. DrugDes 68, 213–219 (2006). [DOI] [PubMed] [Google Scholar]
- 52.Mazzocco C et al. In vivo imaging of prostate cancer using an anti-PSMA scFv fragment as a probe. Sci. Rep 6, 23314 (2016). [DOI] [PMC free article] [PubMed] [Google Scholar]
- 53.Curado S et al. Conditional targeted cell ablation in zebrafish: a new tool for regeneration studies. Dev. Dyn 236, 1025–1035 (2007). [DOI] [PubMed] [Google Scholar]
- 54.Chudakov DM, Lukyanov S & Lukyanov KA Using photoactivatable fluorescent protein Dendra2 to track protein movement. Biotechniques 42, 10.2144/000112470 (2007). [DOI] [PubMed] [Google Scholar]
- 55.Chudakov DM, Lukyanov S & Lukyanov KA Tracking intracellular protein movements using photoswitchable fluorescent proteins PS-CFP2 and Dendra2. Nat. Protocols 2, 2024–2032 (2007). [DOI] [PubMed] [Google Scholar]
- 56.Chen Q et al. Haemodynamics-driven developmental pruning of brain vasculature in zebrafish. PLoS Biol. 10, e1001374 (2012). [DOI] [PMC free article] [PubMed] [Google Scholar]
- 57.Kamoun WS et al. Simultaneous measurement of RBC velocity, flux, hematocrit and shear rate in vascular networks. Nat. Methods 7, 655–660 (2010). [DOI] [PMC free article] [PubMed] [Google Scholar]
- 58.Schaffer CB et al. Two-photon imaging of cortical surface microvessels reveals a robust redistribution in blood flow after vascular occlusion. PLoS Biol. 4, e22 (2006). [DOI] [PMC free article] [PubMed] [Google Scholar]
Associated Data
This section collects any data citations, data availability statements, or supplementary materials included in this article.
Supplementary Materials
Data Availability Statement
Any Methods, including any statements of data availability and Nature Research reporting summaries, along with any additional references and Source Data files, are available in the online version of the paper. 3D reconstruction of vessel surrounding HSPCs in retention hotspot is deposited at http://www.biosino.org/node/project/detail/OEP000169.


