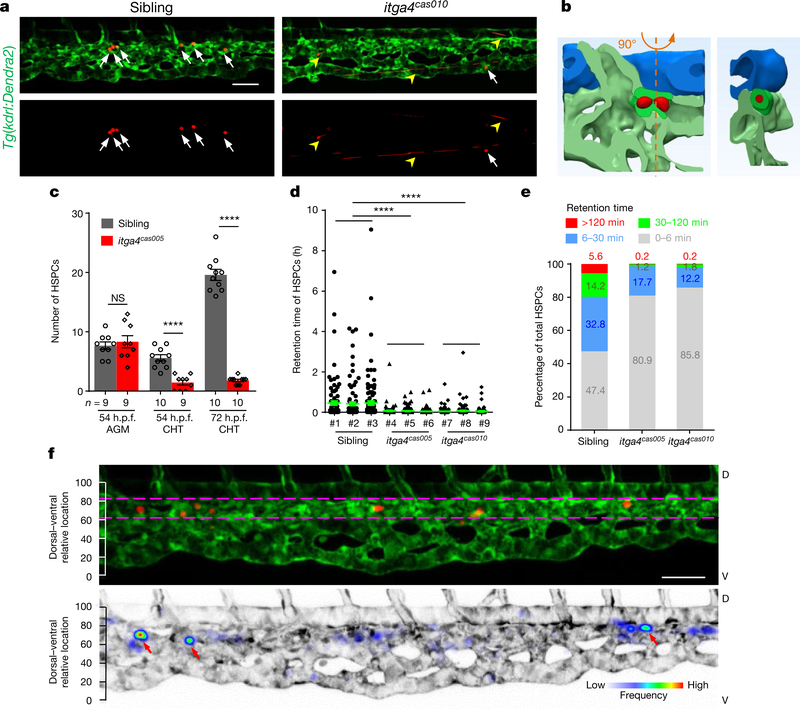
Fig. 1 |. Live-imaging characterization of nascent HSPCs retention in the cHt.
a, Frame shots from the CHT at 54 h.p.f. show HSPCs seeding successfully (white arrows) in wild-type siblings but not in itga4cas010 mutants (fast moving, yellow arrowheads). See Supplementary Video 1. b, A representative vascular architecture view of the HSPC retention hotspot. The orthogonal view is shown on the right. HSPCs, red; dorsal aorta, blue; venous plexus, light green; venous capillary, dark green. See Supplementary Video 4. c, The number of HSPCs in the AGM and CHT ol itga4cas005 mutants and wild-type siblings at 54 and 72 h.p.f., respectively. 54 h.p.f. AGM: P = 0.59, t = 0.55, df = 16; 54 h.p.f. CHT: ****P < 0.0001, t = 6.00, df = 17; 72 h.p.f. CHT: ****P < 0.0001, t = 18.65, df = 18. NS, not significant. d, e, Retention time of individual HSPCs in each embryo (d) and percentage of total HSPCs in four classified retention time zones in group embryos (n = 3) (e) of wild-type siblings and itga4cas005 and itga4cas005 mutants during 50–60 h.p.f. Wild type vs itga4cas005: P < 0.0001, t = 8.56, df = 824; wild type vs itga4cas010: P < 0.0001, t = 7.93, df = 758. f, Top, HSPCs that remained for longer than 30 min were preferentially located in the region enriched with venous capillaries (between the two magenta dashed lines). Bottom, the frequency of the appearance of HSPCs in the entire CHT of Tg(kdrl:Dendra2) zebrafish larvae from 50 to 60 h.p.f. (retention hotspots marked by red arrows). D, dorsal; V, ventral. Scale bars, 50 μm (a, f).

