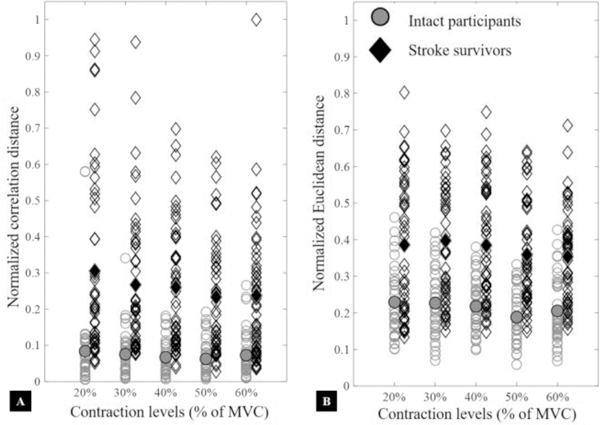
Fig. 5:

Normalized Euclidean and correlation distances between corresponding maps of stroke survivors and intact participants. Normalization was using the highest value to scale the y-axes from zero to unity. Empty shapes present distances between normalized muscle activity maps of opposite arms while the filled ones represent median values. Red and diamond shapes show distances (between opposite arms) for stroke survivors, and blue and circular shapes show the same for intact participants. We observed that corresponding maps of stroke survivors from opposite arms were less correlated and more distant from each other as compared to intact participants (p<.05).
