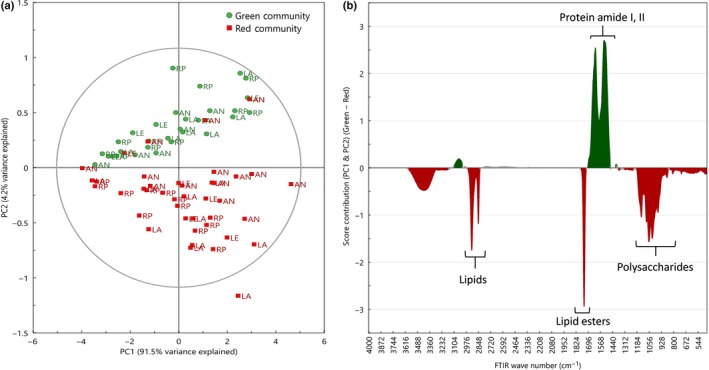
Figure 2.

Metabolic fingerprinting (FT‐IR) reveals differences between green and red blooms. Score scatter plot (a) from principal component analysis of FT‐IR wavenumber intensities of green (circles, n = 30) and red (squares, n = 40) snow algae communities collected from four locations adjacent to the Antarctic Peninsula (Rothera Point (RP), Anchorage Island (AN), Léonie Island (LE) and Lagoon Island (LA)) during January and February 2015 (austral summer). The score contribution plot (b) indicates which FT‐IR wavenumbers differ the most between green (protein, amide I, II) and red (lipids, lipid esters, polysaccharides) snow algae communities along PC1 and PC2.
