Fig. 2.
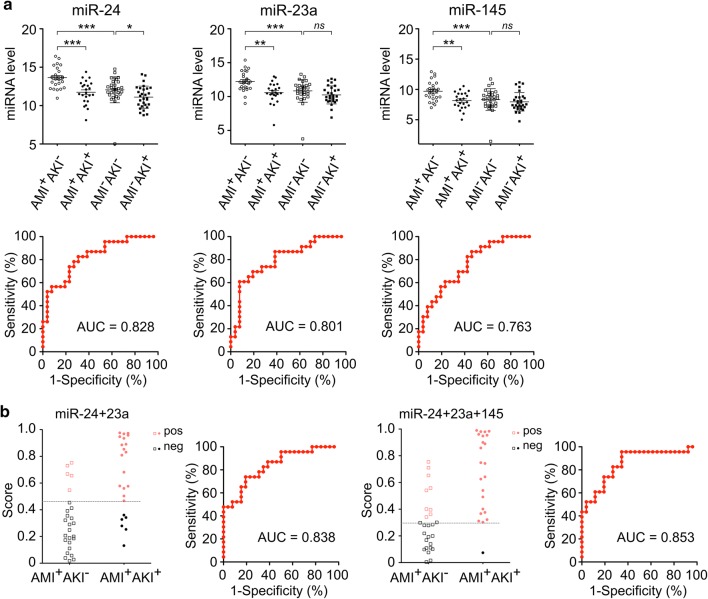
The expression levels and diagnostic performances of miR-24, miR-23a and miR-145 in detecting post-AMI AKI. a Scatter plots representing the distributions for the expression levels of, miR-24, miR-23a and miR-145 in the AMI+AKI− group (open squares) and the AMI+AKI+ group (full circles). P-value was calculated by Mann–Whitney U test. (*P < 0.05; **P < 0.01; ***P < 0.001; ns not significant). The ROC analysis and the AUC values were performed to discriminating between the AMI+AKI− and the AMI+AKI+ groups. b Scatter plots presenting the distributions of scores generated by logistic regression integrating the combined effects of miR-24 + miR-23a, or miR-24 + miR-23a + miR-145, in discriminating between the AMI+AKI− and AMI+AKI+ groups. Scores ranging from 0 to 1 were generated for each sample and used to calculate ROC curves. The positive cases (red dots) in each group were determined according to the individual cut-off value obtained using Youden’s index on the ROC curve. AKI acute kidney injury, AMI acute myocardial infarction, AUC area under receiver operating characteristic curve, ROC receiver-operating characteristic

