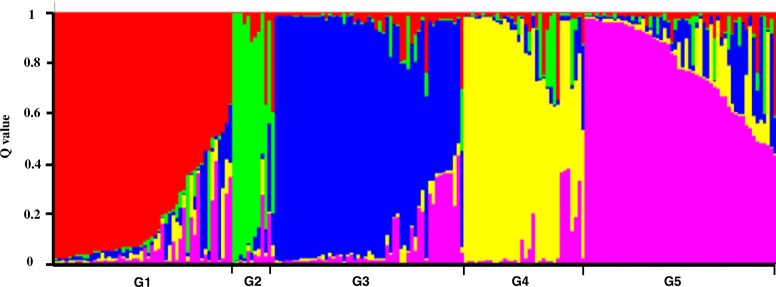
Fig. 3.
Population structure of 210 barley accessions based on 35 SSRs (K = 5). Five colors indicate the subpopulations G1, G2, G3, G4 and G5, respectively. Each accession is represented by a thin vertical line with the lengths proportional to each of the subpopulations. The y-axis is the subgroup membership, and the x-axis is the accessions in the five groups (G1, G2, G3, G4 and G5)

