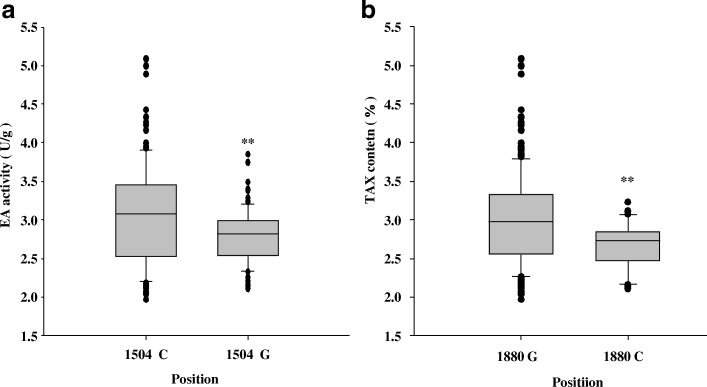
Fig. 7.
EA activity contrasts of different allelic forms. a At position 1504 bp, the EA activity of the C base form is significantly higher than that of the G base form. b At the position of 1880 bp, the EA activity of the G base form is significantly higher than that of the C form. The X-axis indicates the allele; the Y-axis shows the EA activity. ** indicates highly significant level (P < 0.01) of difference between means. –indicates that the base was deleted

