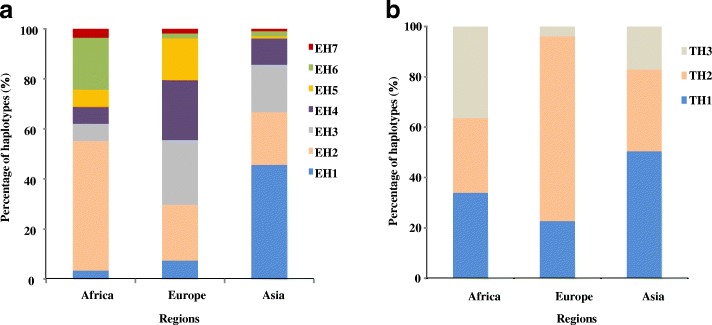
Fig. 8.
The geographic distribution of different haplotypes in HvXYN1. EH (EH1–EH7) and TH (TH1-TH3) represent haplotypes as described in Fig. 4. a The distribution of the haplotypes in EA activity among different geographic locations. b The distribution of the haplotypes in TAX content among different geographic location. The X axis represents the different geographic location, the Y axis represents percentage of haplotypes in EA activity and TAX content

