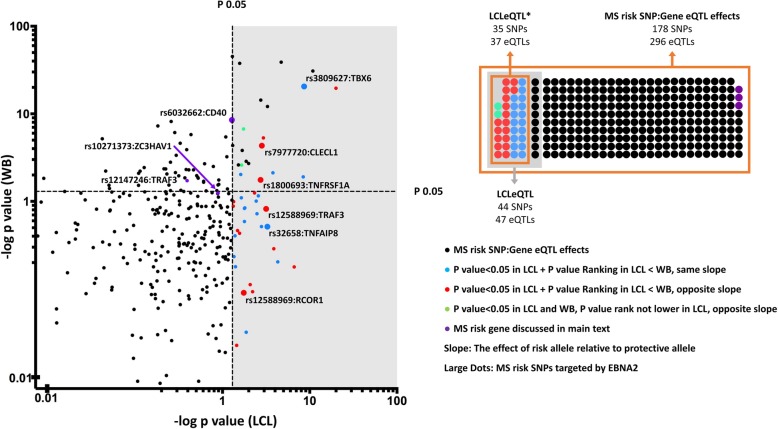
Fig. 2.
The effect of MS risk SNP genotype on expression of proximal genes in whole blood and LCLs. The GTEx eQTL dataset was first filtered for MS risk SNPs, and SNP:gene pairs were then plotted for effect of genotype (restricted to the genes closest to the MS risk SNPs—the proximal genes). SNP:gene pairs that were more strongly associated with expression in LCLs (coloured blue) and those with a different risk allele effect in LCLs compared to whole blood, more significant in LCLs (red) or opposite slope in LCLs(green) were identified as LCLeQTL*

