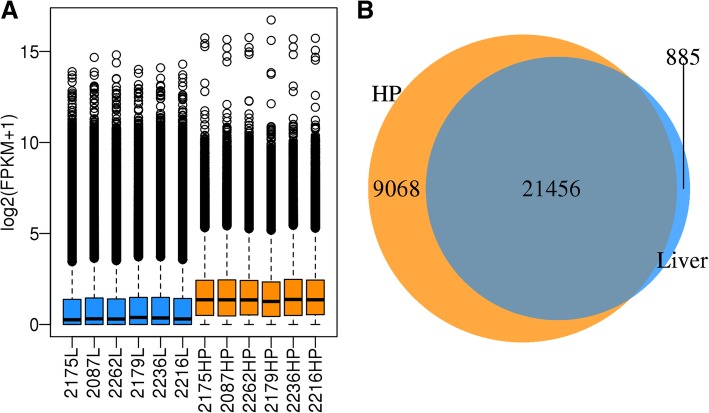
Fig. 1.
The gene expression pattern for Hypothalamus-pituitary (HP) and liver (L) tissue. a The blue samples are for liver tissue, and the yellow samples are for Hypothalamus-pituitary tissue. FPKM: Fragments Per Kilobase of transcript per Million mapped reads. The black bar indicated the average FPMK in the tissue. b Gene co-expression in the two tissues. Most of genes were co-expressed in the two tissues

