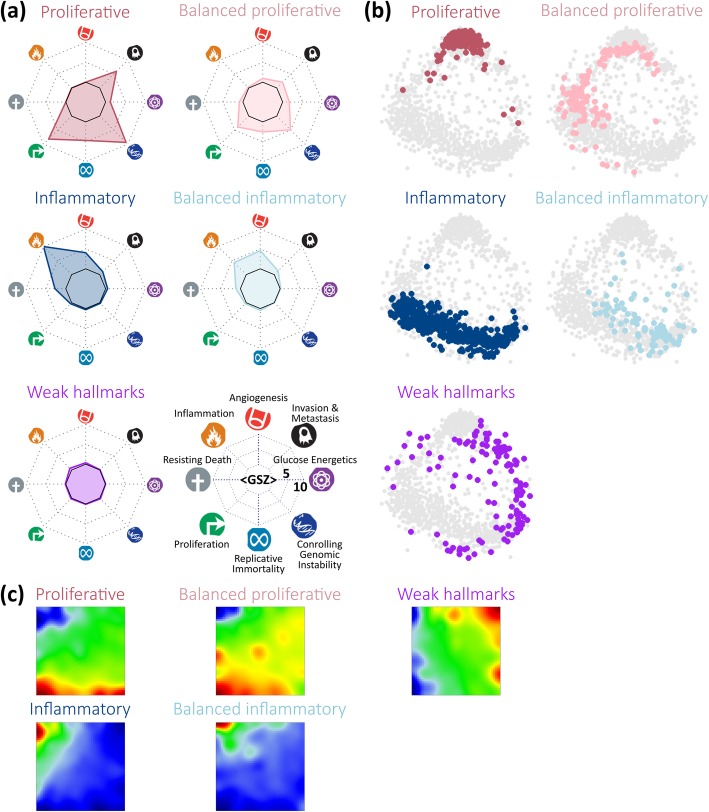
Fig. 7.
Cancer hallmark types (HT) were characterized using an expression signature for each of the eight hallmarks and clustering of the lymphoma samples into five HT. a The expression levels of the hallmark signatures were presented in terms of a polar plot (hallmark diagrams) for each of the HTs. Each hallmark is assigned to one polar axis as indicated in the legend. HTs differ markedly regarding the hallmarks ‘inflammation’ on the one hand and ‘proliferation’ and ‘invasion and metastasis’ on the other hand. b Samples assigned to each of the five HTs were colored in the correlation network, where each dot represents one sample. It reveals that the proliferative, inflammatory and weak HTs occupy three different, mutually separated regions while the two balanced HTs fill the transition zones in between them. c Mean expression portraits of the HTs reveal different regions of over- and under-expression, which can be directly compared with the portraits of the subtypes (Fig. 1a) and PATs (Fig. 5)

