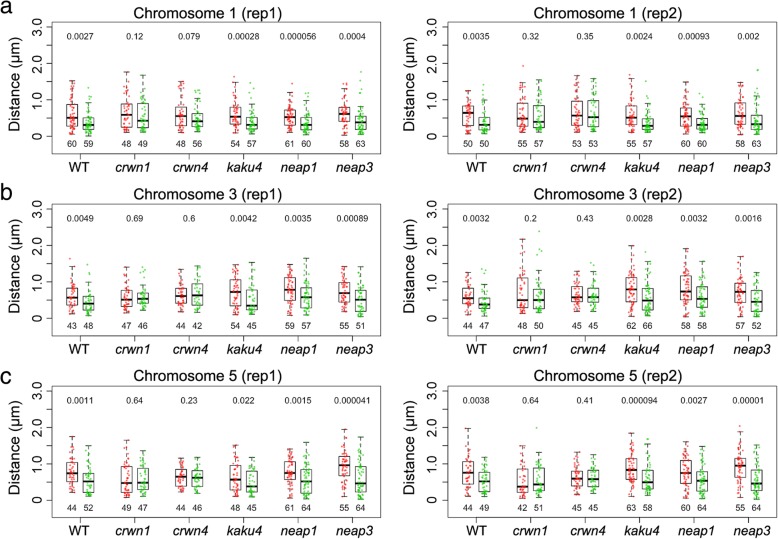
Fig. 2.
Analyses of FISH signals in Arabidopsis lamin-like gene mutants. a–c Distances of probed genomic regions in chromosome 1 (a), 3 (b), and 5 (c) to the NP are compared in 2C nuclei of various genetic backgrounds. Boxplots with green and red dots denote data of Green and Red probes (same as those shown in Fig. 1d), respectively. For each pair of comparison (boxplots of the same genotype), the p value on top indicates the Mann-Whitney U test result. WT, wild-type

