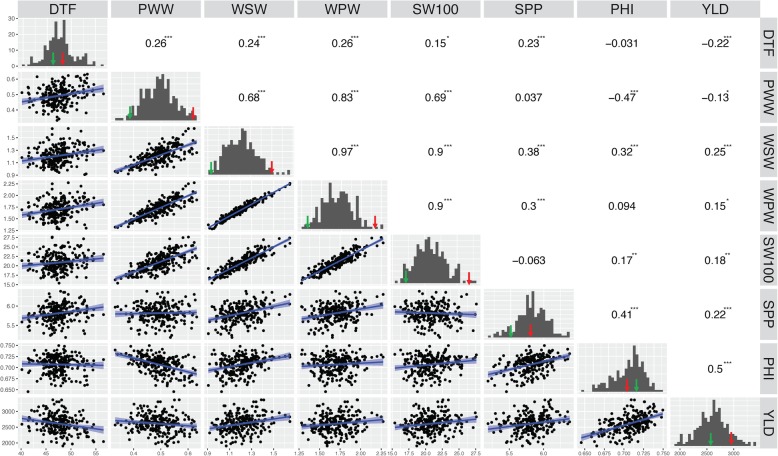
Fig. 1.
Matrix of trait frequency distribution (diagonal), joint distribution (lower triangle), and correlation coefficient (upper triangle) of the traits averaged across environments in the ICA Bunsi x SXB405 RIL population. Traits: days to flowering (DTF), pod wall weight (PWW), whole seed weight (WSW), whole pod weight (WPW), 100- seed weight (SW100), seeds per pod (SPP), pod harvest index (PHI), Yield (YLD). Parental means are showed as arrows in red (ICA Bunsi) and green (SXB405)

