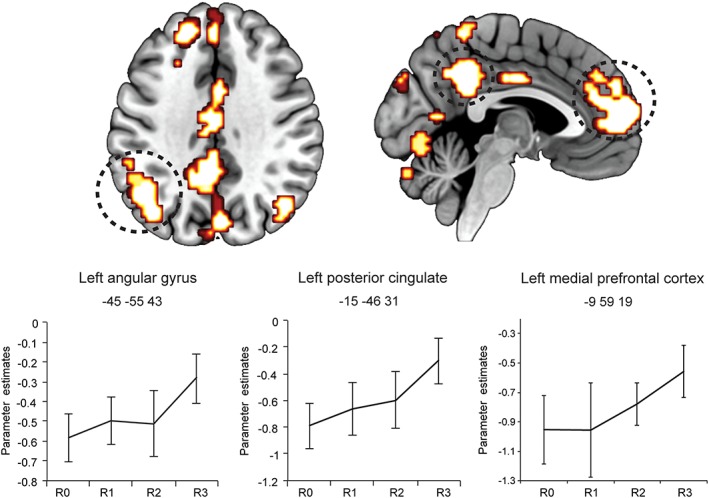
Figure 2.

Brain regions responding to recollection strength at retrieval and parameter estimate plots. Error bars show the SEM. R0 = recollection misses; R1 = weak recollection; R2 = moderate recollection, R3 = strong recollection [Color figure can be viewed at wileyonlinelibrary.com]
