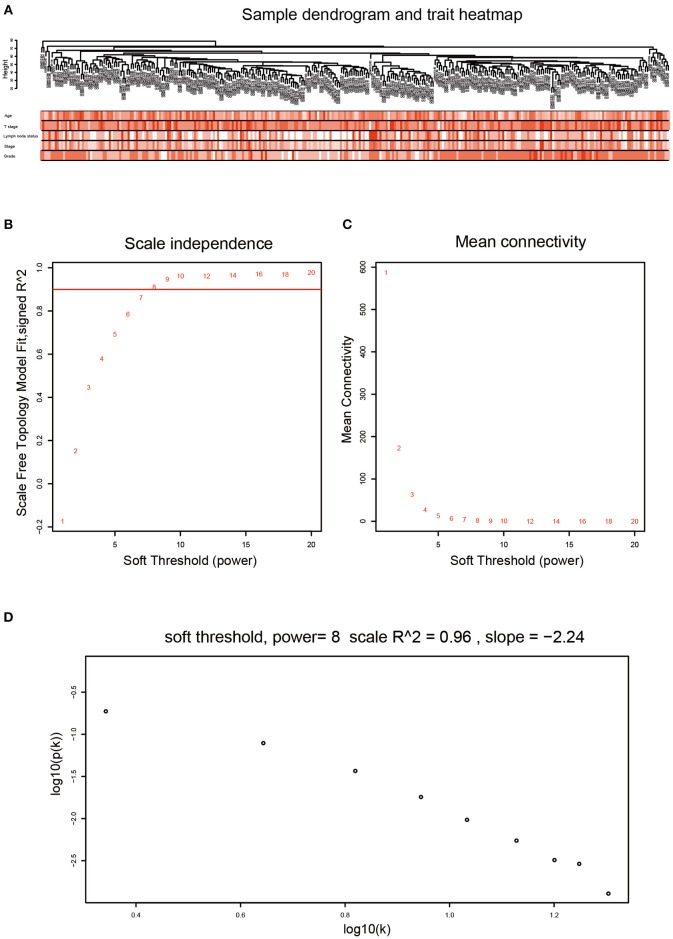
Figure 1.
Clustering dendrogram and determination of soft-thresholding power in the WGCNA. (A) Clustering dendrogram of 302 samples. (B) Analysis of the scale-free fit index for various soft-thresholding powers (β). (C) Analysis of the mean connectivity for various soft-thresholding powers (β). We choose the lowest β that results in approximate scale free topology. (D) Checking the scale free topology when β = 8. The x-axis shows the logarithm of whole network connectivity, y-axis shows the logarithm of the corresponding frequency distribution. On this plot the distribution approximately follows a straight line, which is referred to as approximately scale-free topology.

