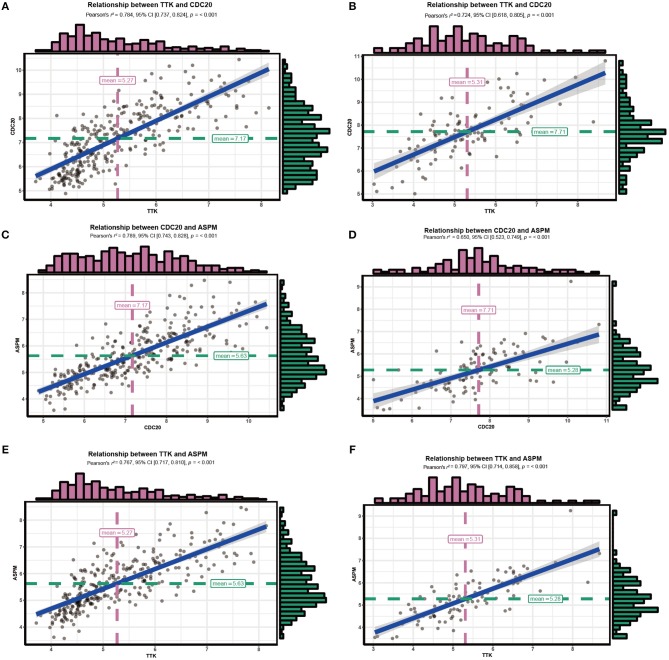
Figure 11.
Correlations among hub genes. (A) Correlation between CDC20 and TTK in GSE25055. (B) Correlation between CDC20 and TTK in GSE42568. (C) Correlation between ASPM and CDC20 in GSE25055. (D) Correlation between ASPM and CDC20 in GSE42568. (E) Correlation between ASPM and TTK in GSE25055. (F) Correlation between ASPM and TTK in GSE42568.

