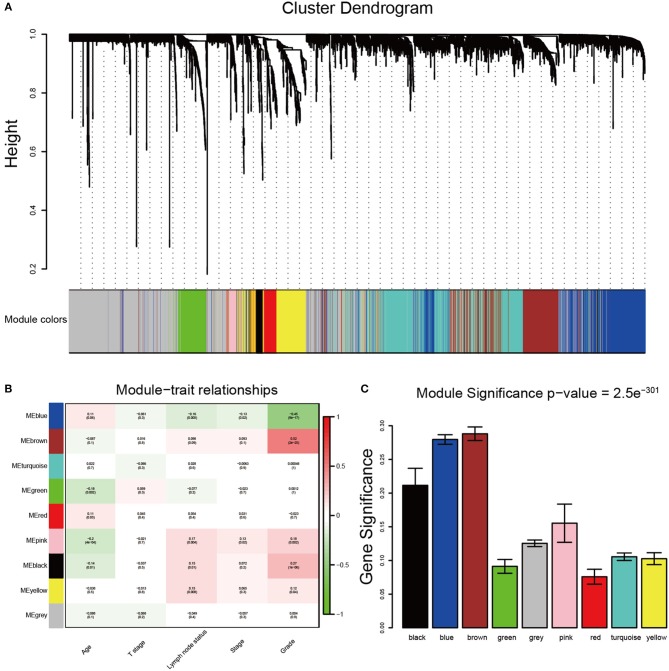
Figure 2.
Identification of modules associated with the clinical traits of breast cancer. (A) Dendrogram of all differentially expressed genes clustered based on a dissimilarity measure (1-TOM). The color band provides a simple visual comparison of module assignments. The color band shows the results from the automatic single block analysis. (B) Heatmap of the correlation between module eigengenes and clinical traits of breast cancer. (C) Distribution of average gene significance and errors in the modules associated with tumor grades of breast cancer.

