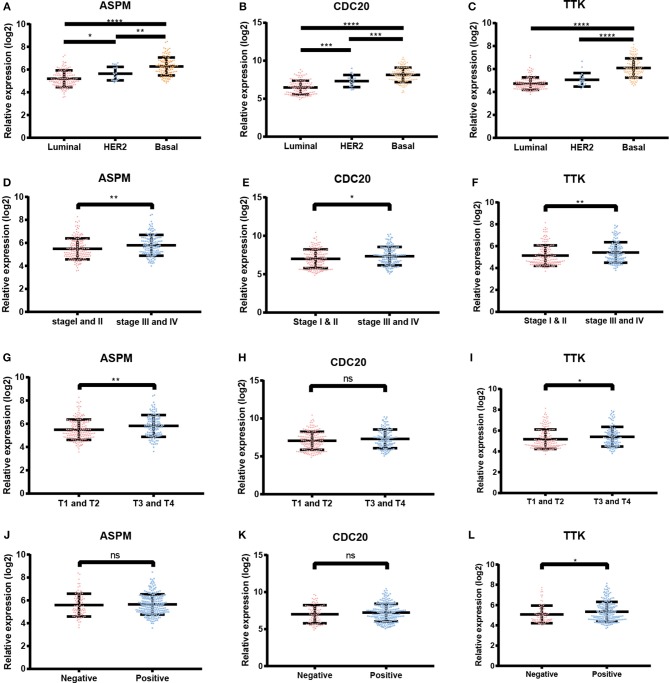
Figure 7.
Expression levels of ASPM, CDC20 and TTK. (A) ASPM expression and breast cancer subtypes. (B) CDC20 expression and breast cancer subtypes. (C) TTK expression and breast cancer subtypes. (D) ASPM expression and tumor stages. (E) CDC20 expression and tumor stages. (F) TTK expression and tumor stages. (G) ASPM expression and tumor sizes. (H) CDC20 expression and tumor sizes. (I) TTK expression and tumor sizes. (J) ASPM expression and lymph node status. (K) CDC20 expression and lymph node status. (L) TTK expression and lymph node status. *P < 0.05; **P < 0.01; ***P < 0.001; ****P < 0.0001. One-way analysis of variance (ANOVA) and two-tailed Student's t-tests were used to evaluate the statistical significance of differences.

