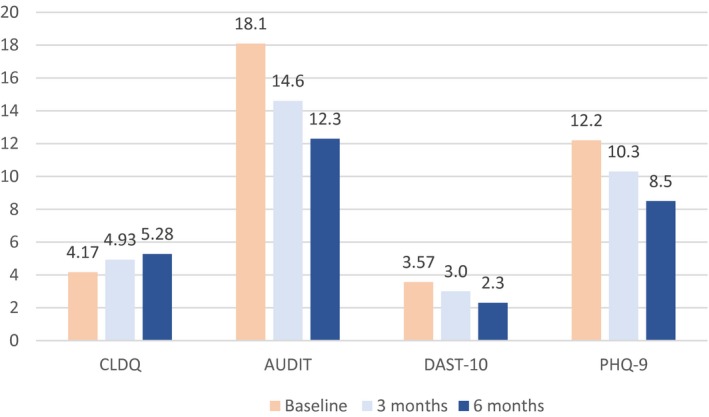
Figure 5.

Mean scores at baseline and at 3 and 6 months for all study instruments. CLDQ scores measure quality of life, with higher values better. AUDIT, DAST‐10, and PHQ‐9 scores measure disease severity, with lower values better. CLDQ improved at 3 months and at 6 months (each P < 0.0001). AUDIT improved at 3 months (P = 0.0018) and 6 months (P = 0.0048). DAST‐10 improved at 6 months (P = 0.038). PHQ‐9 improved at 3 months and at 6 months (each P < 0.0001).
