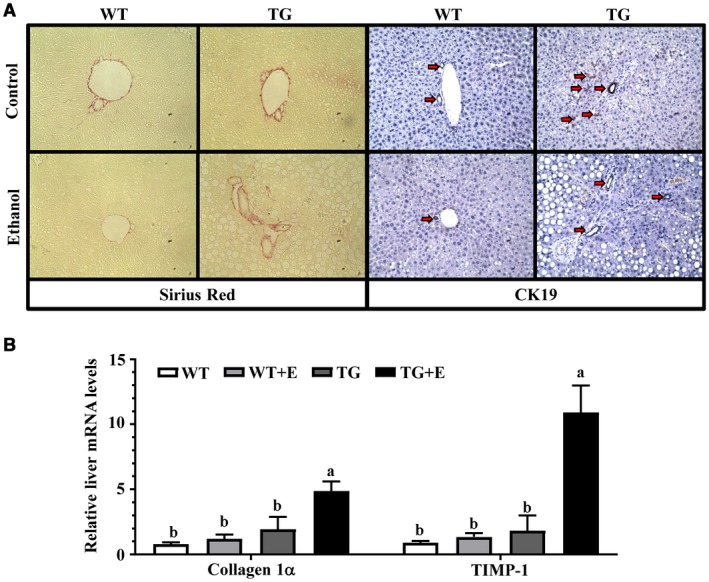
Figure 2.

Adipose‐specific lipin‐1 overexpression induced liver fibrosis in ethanol‐fed mice. Mice were fed as described in Fig. 1. (A) Sirius red and CK19 staining (original magnification × 100). (B) Relative liver mRNA levels of collagen 1α and TIMP‐1. Results are shown as means ± SEM (n = 5‐9 mice). Means without a common letter differ, P < 0.05.
