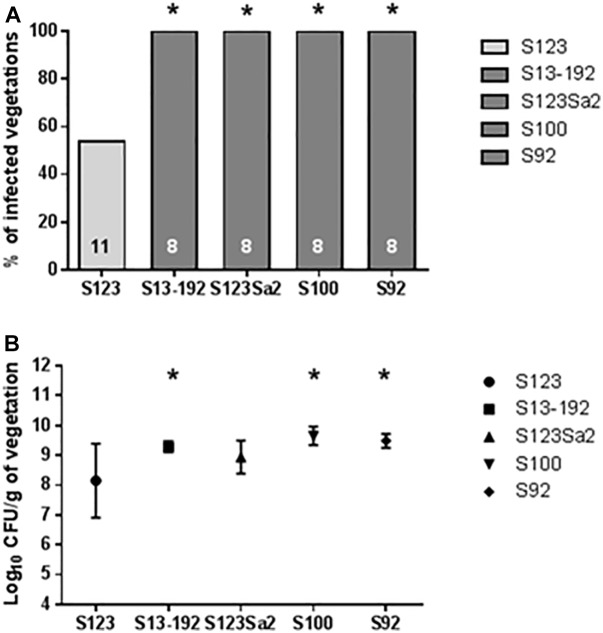
FIGURE 4.
Results of experimental endocarditis. Incidence of endocarditis (A) and bacterial densities in infected vegetations (B) in rats 24 h after inoculation with 104 CFUs of the tested S. aureus. The numbers of animals in each group are indicated at the bottom of the columns. Bacterial densities in (B) are expressed as mean ± SD. ∗ Indicates values that were significantly different (P < 0.05) from values for strain S123 by using either the Fisher’s exact test (infected vegetations) or the Student’s t-test (bacterial densities).

