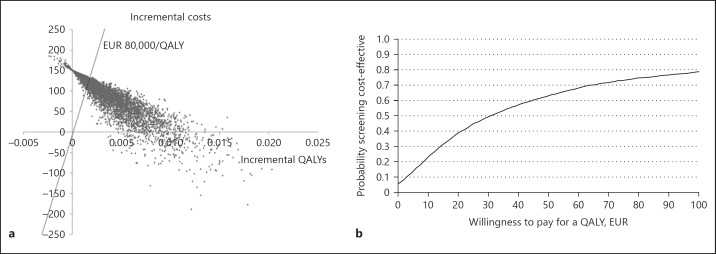
Fig. 2.
a, b Cost-effectiveness plane and cost-effectiveness acceptability (CEA) curve. Outcomes of the simulation presented in a cost-effectiveness plane, with corresponding CEA curve. This curve shows that the probability OPRM1-guided treatment allocation is cost-effective, compared to no screening for different willingness to pay (WTP) thresholds.

