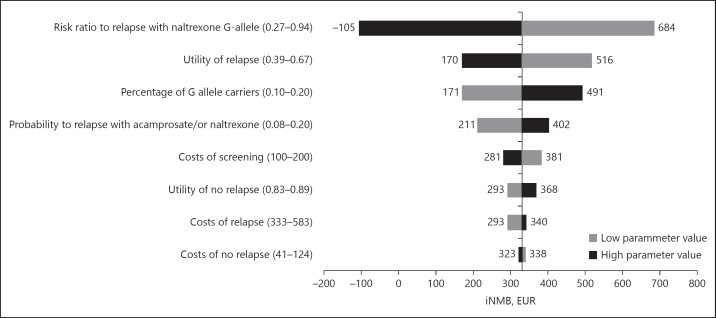
Fig. 3.
Tornado diagram, summarizing the results of the univariate sensitivity analyses. In these analyses, the presented parameter estimates vary within an uncertainty range (presented behind each parameter), to see the influence on the incremental Net Monetary Benefit (iNMB) for a Willingness To Pay (WTP) of EUR 80,000/QALY (vertical line representing the iNMB of the base-case analysis).

