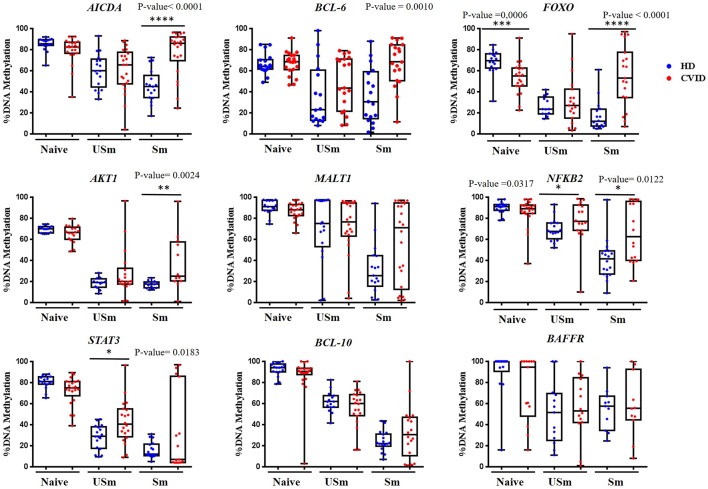
Figure 1.
Percentage of DNA methylation obtained by pyrosequencing for the selected CpG in different genes, represented as box and whiskers, in the B cell subsets naïve, unswitched (USm) and switched (Sm) memory B cells from healthy donors (in blue) and CVID patients (in red). Box represent mean with minimum to maximum. P-value of statistically significant differences by Mann-Whitney test are included (*p < 0.05; **p < 0.01; ***p < 0.001; ****p < 0.0001).

