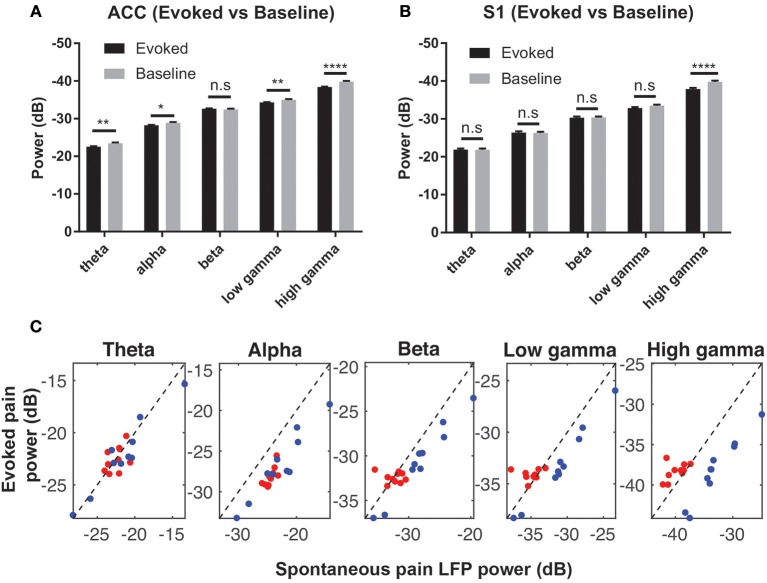
Figure 4.
(A) Comparison of the mean LFP power between evoked pain and baseline at various frequency bands in the ACC (A) and S1 (B) (rats #12–15, n = 232 trials). Note that the y-axis shows the negative value in dB. *p < 0.05; **p < 0.01, ****p < 0.0001, paired t-test. (C) Mean LFP power comparison between the evoked and spontaneous pain-like episodes (ACC: red; S1: blue; rats #12–15, n = 10 sessions).

