Figure 6.
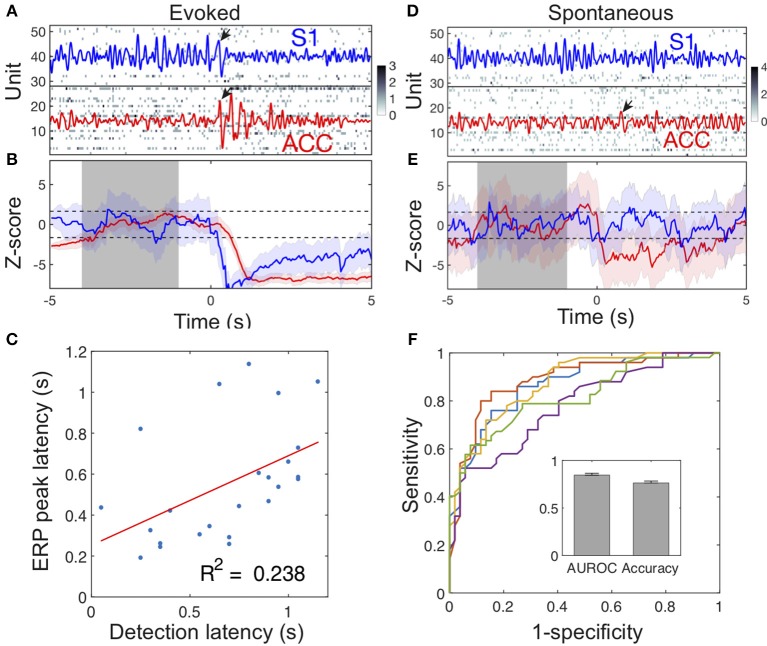
Illustration of detecting acute and spontaneous pain-like events. (A) The simultaneous ACC and S1 ensemble spike activity during a laser-evoked pain episode. Dark pixel represents high spike count. Time 0 denotes the onset of 250 mW laser stimulation. The ACC (red) and S1 (blue) LFPs were overlaid in the spike raster. Pain-induced ERPs are marked by arrows. In this example, the S1 ERP peak occurred 30 ms earlier than the ACC ERP peak. (B) The evoked pain event was detected based on our previously developed algorithm (Methods). Shaded periods of [−4, −1] s denote the baseline for computing the Z-score (ACC: red; S1: blue). When the upper or lower confidence interval of the Z-score was below or above the significance threshold (horizontal dash lines), the onset of pain signal was detected as a change point. In this example, the detected acute pain onset in the S1 was earlier than the onset in the ACC, whereas the S1 ERP peak latency was also earlier than the ACC ERP peak latency. (C) During evoked pain episodes, the ensemble spike-based acute pain detection latency to the stimulus onset positively correlated with the ERP peak latency (n = 24 trials; p = 0.0156, Pearson's correlation). (D,E) Similar to respective panels A,B, except for a spontaneous pain-like episode. Time 0 denotes the onset of paw withdrawal. (F) Receiver operating characteristic (ROC) curves of 5-fold cross-validated SVM classification for spontaneous pain. The AUROC and accuracy statistics (mean ± SEM) are shown in the inset.

