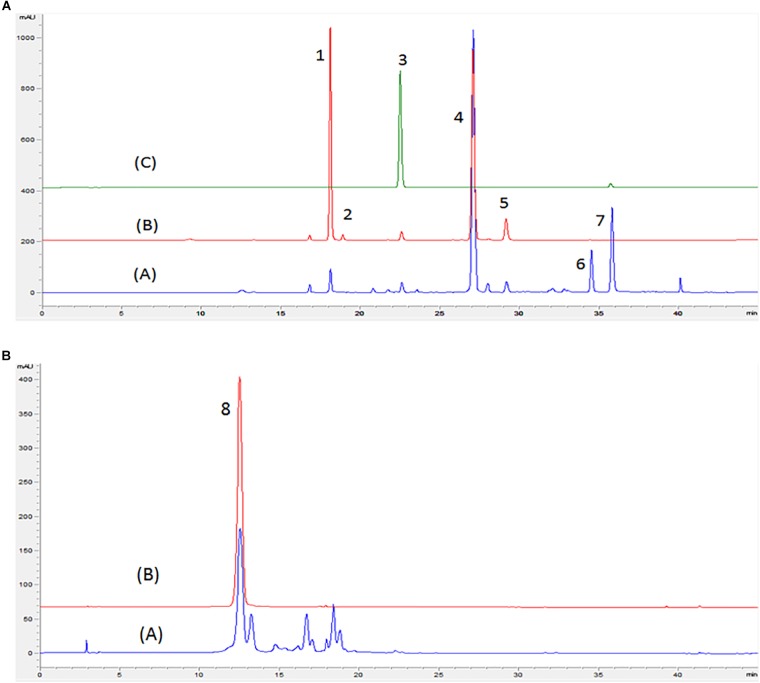
FIGURE 1.
Chromatogram obtained by HPLC-DAD in wavelengths of 370 (A) and 525 nm (B) of red and white onion. (A) Red onion, (B) White onion, (C) Quercetin 3-O-glucoside standard. Peaks identified: peak 1 – Quercetin 3,4-O-diglucoside; peak 2 – Isorhamnetin 3,4′-diglucoside, peak 3 – Quercetin 3-O-glucoside; peak 4 – Quercetin 4′-O-glucoside; peak 5 – Isorhamnetin 4- glucoside; peak 6 – Quercetin glycoside; peak 7 – Quercetin aglycone; peak 8 –Cyanidin 3-O glucoside. Identification shown in Table 1.

