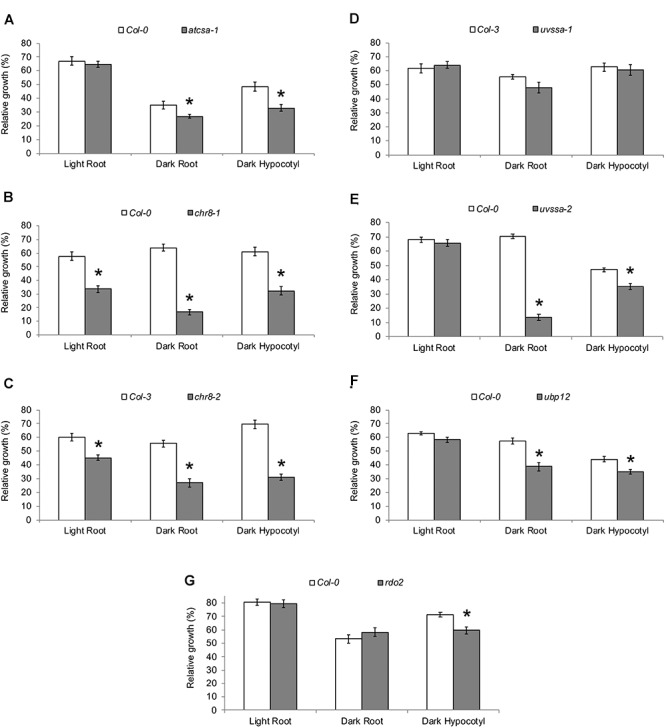
FIGURE 4.

UV tolerance of mutants in TCR genes. Relative growth of roots and hypocotyls of (A) atcsa-1, (B) chr8-1, (C) chr8-2, (D) uvssa-1, (E) uvssa-2, (F) ubp12, and (G) rdo2 after 1000 J m-2 UV treatment, followed by 2 days of long-day (light) or dark incubation. Data are expressed as length relative to unirradiated control of the same genotype. Values are means ± SE (n = 20), ∗p ≤ 0.05 of mutants vs wild type.
