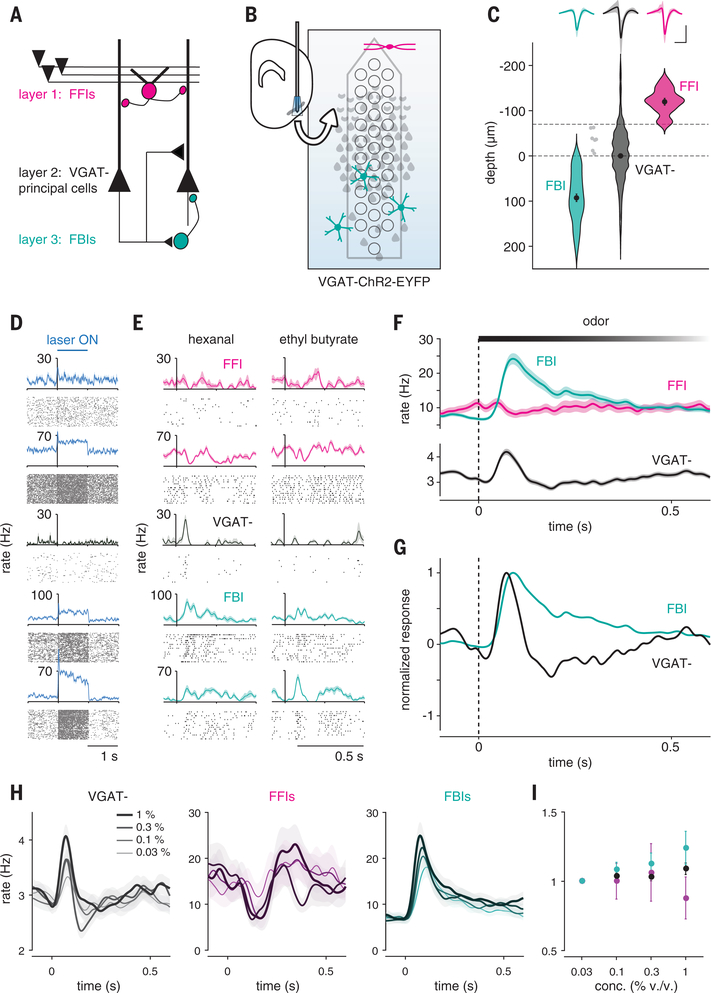
Fig. 3. Feedback inhibition shapes cortical odor responses.
(A) Schematic of PCx circuit: FFIs in layer 1 receive OB input; principal cells in layer 2 provide recurrent excitatory input to other principal cells and to FBIs in layer 3. (B) Recording schematic. Light-responsive FFIs and FBIs in VGAT-ChR2 mice are differentiated by their depths relative to VGAT− principal cells in layer 2, which are suppressed. (C) FFIs (magenta, n = 13), FBIs (teal, n = 46), and VGAT− (black, n = 855) are classified by light-responsiveness and depth (dashed line). Dots with error bars are mean ± SEM. Light gray indicates unclassified light-responsive cells. (Top) Average waveform of each cell type (mean ± SEM). Scale bars, 0.5 ms, 0.1 mV. (D) Example light responses for one PC (black) and four cells classified as FFIs or FBIs (blue). (E) Example odor responses for cells in (D). (F) Average population PSTHs (mean ± SEM) for each cell type. (G) Normalized PSTHs for FBIs and VGAT− cells. (H) Average population PSTHs for (left) VGAT−, (middle) FFIs, and (right) FBIs responding to odors at increasing concentrations. (I) Normalized firing rates in response to increasing odor concentrations for each cell type (mean ± SEM).

