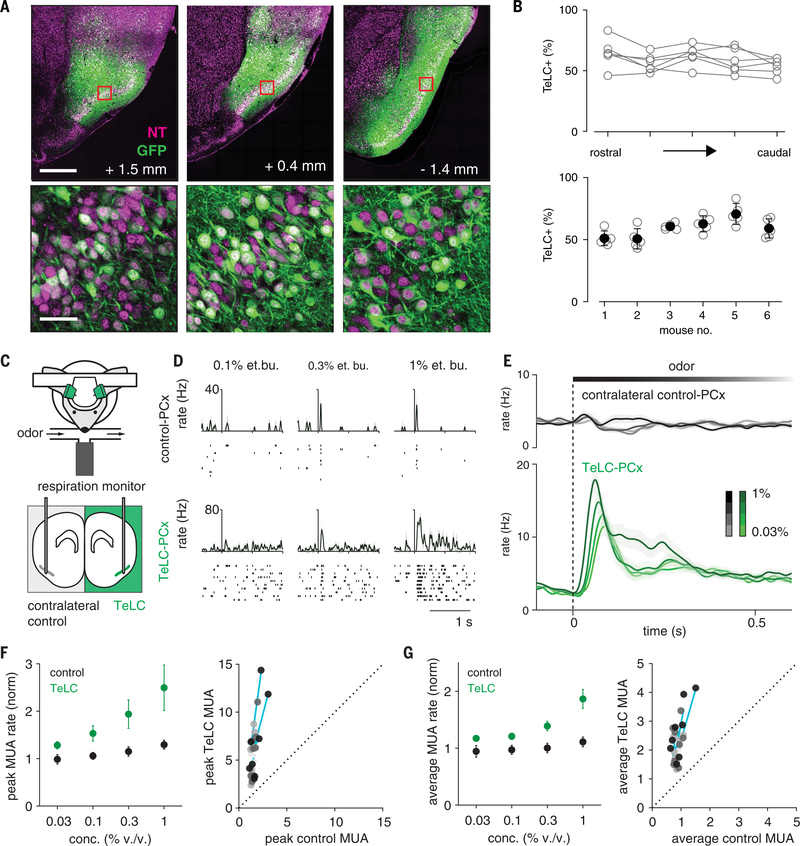
Fig. 5. Recurrent circuitry truncates and normalizes cortical output.
(A) Extensive infection of layer 2 principal cells across PCx in an example mouse. GFP, green; NeuroTrace, magenta. Numbers indicate distance from bregma. Bottom row are the square sections from the top row. Scale bars, 500 μm (top) and 50 μm (bottom). (B) Percent cells expressing TeLC-GFP in six of seven mice used. Sections from one mouse were damaged, and infection could not be quantified. (Top) TeLC infection across rostral-caudal PCx. (Bottom) Low variation in TeLC expression across mice. (C) Experimental schematic. Simultaneous bilateral recordings from TeLC-infected and contralateral control hemisphere with odor stimuli. (D and E) Example responses (D) and average population PSTHs (E) (mean ± SEM; control, n = 450 cell-odor pairs; TeLC, n = 388 cell-odor pairs) (F) Normalized peaks in MUA rates (n = 4 experiments, two odors, four concentrations). (Left) Peak responses across recordings and odorant concentrations. (Right) Each point is average response of one simultaneously recorded TeLC-Control PCx pair normalized to mineral oil response. Shading indicates concentration. Cyan lines are linear fits for each experiment through all concentrations. (G) As in (F) but for average rate over the first 330 ms after inhalation.

