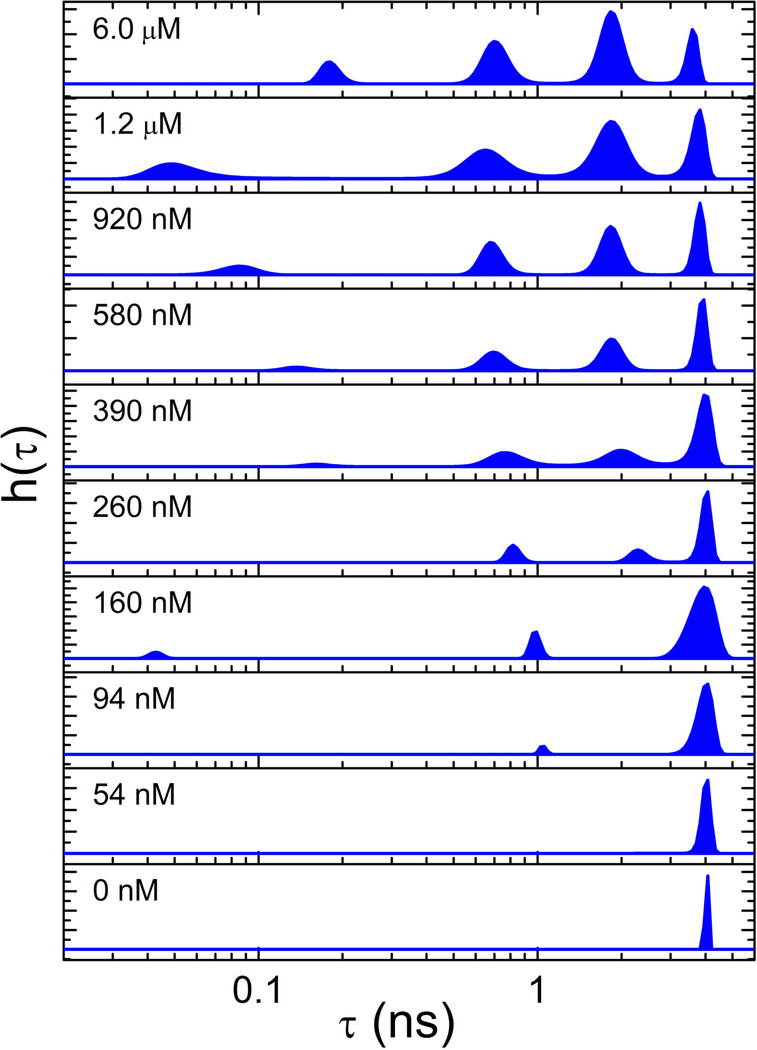
Figure 3.
MEM lifetime distributions for CaM-AF488-S1179D-eNOS at the Ca2+ concentrations listed in each panel. Excitation was at 488 nm and emission was detected at 515 nm. Quenching increases with decreasing lifetime from right to left. Note that variation in the lifetime of the shortest-lifetime population is magnified by the log scale. Figure used with permission from ref. (40)

