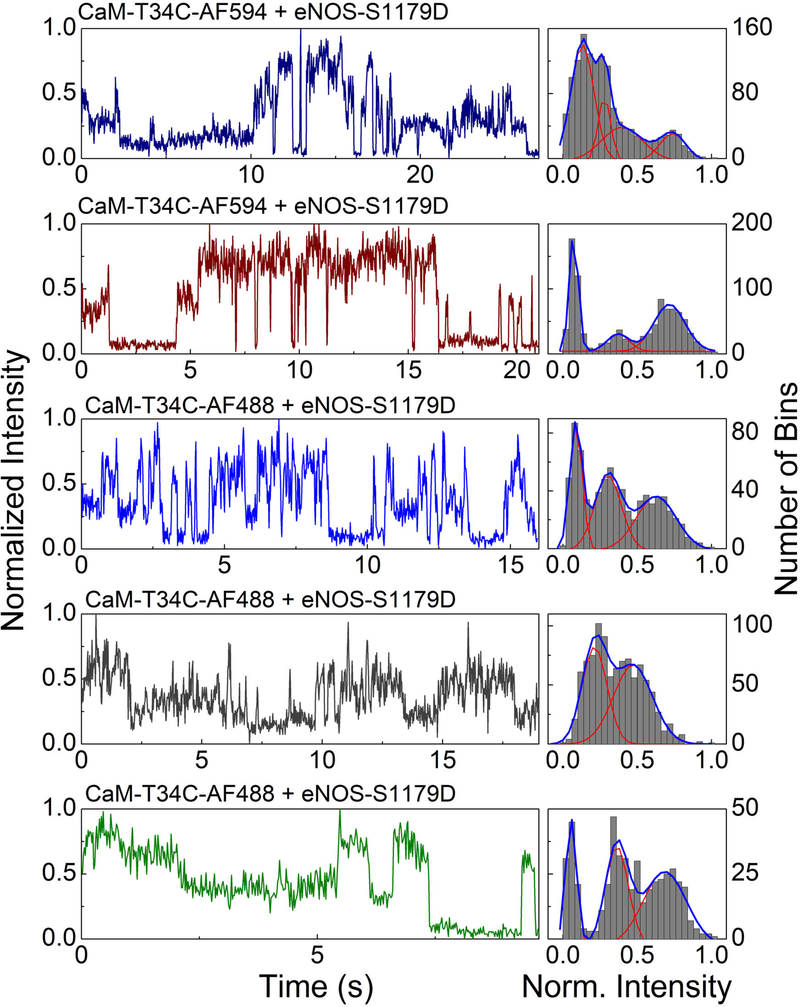
Figure 5.
Single molecule trajectories (left) and histograms (right) for immobilized eNOS-S1179D; top two panels, on Cu2+ surface with CaM-T34C-AF594; middle panel, in agarose gel with CaM- AF488; bottom two panels, on Cu2+ surface with CaMAF488. Trajectories were recorded in 20-ms time bins. The right column for each trajectory shows a histogram of the normalized fluorescence intensity per time bin over the course of the trajectory with fits to sums of Gaussian distributions. Intensities were normalized to the range between the minimum and maximum intensity. The left axis label applies to the fluorescence trajectories and the right axis label to the intensity histograms. Figure adapted with permission from ref. (40).

