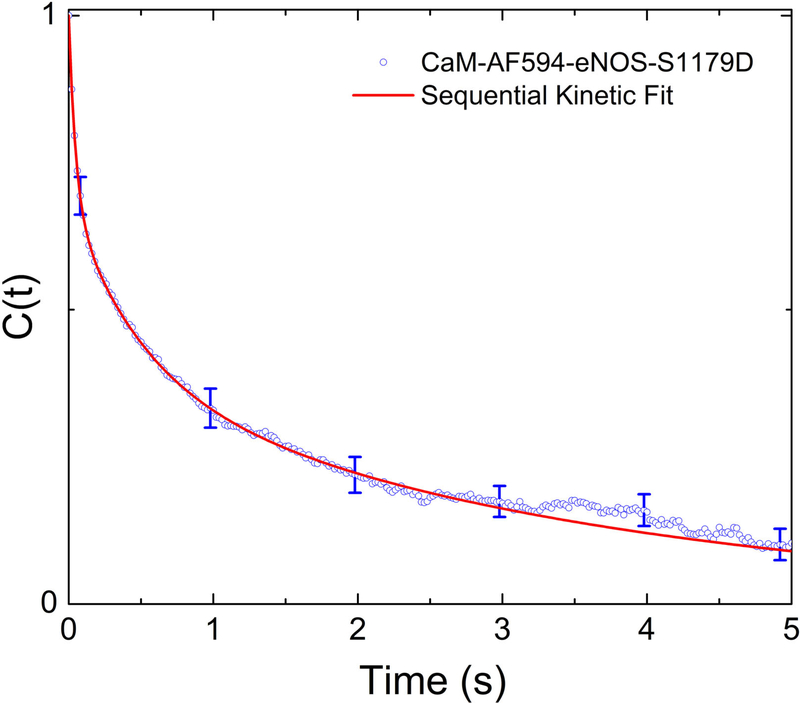
Figure 6.
Correlation function calculated single-molecule fluorescence trajectories of CaM-AF594 bound to eNOS-S1179D. Correlation functions were calculated from individual trajectories and then averaged together. Error bars show 95% confidence limits. The red line shows a fit to a sequential kinetic model discussed in Section 4.2 (Scheme 4). Data were replotted from ref. (40).

