
FIG. 6.
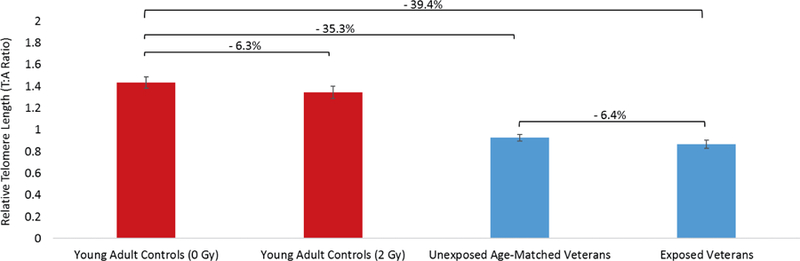
Relative telomere length in cohorts based on age and radiation exposure; young adults (red) and veterans (blue). Values between bars represent percentage change between groups. Error bars represent SEM.
Official websites use .gov
A
.gov website belongs to an official
government organization in the United States.
Secure .gov websites use HTTPS
A lock (
) or https:// means you've safely
connected to the .gov website. Share sensitive
information only on official, secure websites.
Relative telomere length in cohorts based on age and radiation exposure; young adults (red) and veterans (blue). Values between bars represent percentage change between groups. Error bars represent SEM.