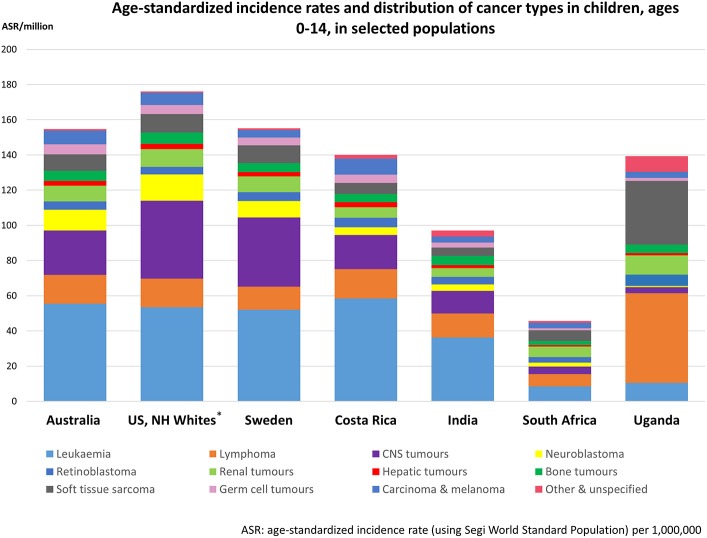
Figure 1.
Observed age-standardized incidence rates and distribution of cancer types in children, ages 0–14 in selected populations, ordered by degree of socioeconomic development. Data compiled from the International Incidence of Childhood Cancer, Volume III (12) and cancer register data from Costa Rica (25) and South Africa (26). Diagnostic groups defined according to the International Classification of Childhood Cancer, including non-malignant intracranial and intraspinal tumors. Exceptions are the CNS tumor rates of Costa Rica, India, South Africa, and Uganda; these rates do not include non-malignant brain tumors. *Non-Hispanic Whites.

