Figure 2.

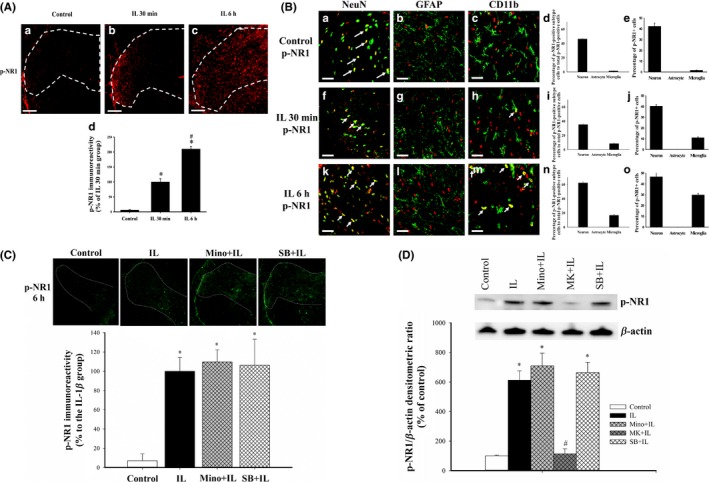
Effects of IL‐1β, SB203580, and minocycline on the level of p‐NR1 in the rat lumbar spinal cord dorsal horn (SCDH) and colocalization of p‐NR1 with other proteins. (A) Representative immunohistochemical images of p‐NR1 (red) in control rats (a), and at 30 min (b) and 6 h (c) after intrathecal injection of IL‐1β (magnification: 100×; scale bars: 200 μm). Quantification of these results (d, 4 sections per rat, 4 rats per group). *P<.05 relative to control. #P<.05 relative to 30 min after IL‐1β injection. (B) Representative confocal immunofluorescence microscopy images (20‐μm sections) showing the localization of p‐NR1 (red in all images) and NeuN in neurons (green in left row), GFAP in astrocytes (green in middle row), and CD11b in microglia (green in right row) in three groups (magnification: 630×; scale bar: 25 μm). Colocalization is indicated by yellow and arrows (a, f, h, k, and m). The percentage of neurons, astrocytes, and microglia expressing p‐NR1 to the total number of p‐NR1‐positive cells are depicted in histograms (d, i, and n). The percentages of p‐NR1‐positive cells in neurons, astrocytes, and microglia populations are depicted in histograms (e, j, and o). (C) Representative immunohistochemistry results show the distribution of p‐NR1 in SCDH (top, magnification: 25×) and quantification of these results (bottom) in the control, IL, Mino+IL, and SB+IL groups. *P<.05 relative to controls. #P<.05 relative to IL‐1β‐injected rats. (D) Representative Western blotting results of p‐NR1 in SCDH at 6 h after drug treatment (top) and quantification of these results (bottom). Values indicate means±SEMs, with 4 sections per rat and 4 rats for each group. *P<.05 vs saline‐injected controls. #P<.05 vs IL‐1β‐injected rats
